| Gender | n | percent |
|---|---|---|
| Female | 50,000 | 50 |
| Male | 50,000 | 50 |
Technical Supplement for the Strong 244 Assessment
Introduction
The value of vocational interests
Strong (1955) noted that “It is customary to view personnel work in all its ramifications as a very recent innovation, dating from about 1910…but it is well to realize that the conception of personnel work has long been in existence as attested by a quotation from Plato, who lived from 427 to 347 BC. In Book II of The Republic he says: ‘No two persons are born exactly alike, but each differs from each in natural endowments, one being suited from one occupation and another for another…It follows, that all things will be provided in superior quantity and quality, and with great ease, when each [person] works at a single occupation, in accordance with [their] natural gifts.’”
The purpose of the Strong 244 (so named because it has 244 questions) is similar to that of previous editions: To help people match their interests with occupational, educational, and leisure pursuits that are compatible with those interests. The most common use of the Strong assessment is to help people explore careers so that they can make sound educational and career choices.
The Strong assessment is a highly regarded (Case & Blackwell, 2008; Su et al., 2009) vocational interest assessment containing a variety of different measures. Some of these measures are broad and used across many interest assessments (e.g., the General Occupational Themes, some of these measures are more specific (e.g., the Basic Interest Scales), and some are specific to occupations and rarely found on other inventories (e.g., the Occupation Similarity Scales). This version of the Strong assessment also adds new sets of results for Major Similarity Scales. Administrative Indexes help in understanding broad response patterns and check for inattentive responding.
Evidence indicates that when an individual’s vocational interests are aligned with academic majors and work environments, satisfaction and performance increases, and they tend to be happier (Harris & Rottinghaus, 2015; Morris, 2003; Nye et al., 2012, 2018; Nye & Prasad, 2021; Su, 2012). Accordingly, using interests to better match people with majors and occupations has the potential to increase student retention, job performance, and career success. Taking the Strong assessment and going through an interpretation also increases an individual’s confidence in their ability to make good career decisions (Brennan, 2009; Luzzo & Day, 1999).
Using this manual and request for feedback
This is intended as a supplement to the technical manual for the 2004 Strong (Donnay et al., 2005). The focus here is on the technical properties of the new assessment, while the previous technical manual offers valuable background and conceptual material that is essential to fully understanding the new assessment. Readers are urged to obtain a copy of the 2004 manual and use it in conjunction with these pages.
Because the supplement is online and easily updated, please contact us if you have any comments, additions, corrections, or questions about this supplement. You can write us: MBC Research.
Overview of changes in the Strong 244 assessment
A number of changes have been introduced in this version of the Strong assessment. These include improvements for every section of results and several important new results:
- Gender is not used in any scoring, so a response to the gender demographic question is not required from the respondent.
- The assessment has been shortened by 47 questions.
- IRT based scoring is used for all General Occupation Themes, all Basic Interest Scales, and several Personal Style Scales.
- General Occupation Theme codes are assigned for all respondents, even those with low scores on all themes.
- Two new Basic Interest Scales have been added: Hospitality & Tourism and Conservation & Environmentalism.
- One new Personal Style Scale has been added, separating the previous Work Style scale into two scales consistent with the Prediger (1982) model.
- New occupation similarity scales for 321 occupations.
- New academic major similarity scales for 177 majors.
- Improved detection of random responding.
General Representative Sample (GRS)
Updates to the Strong assessment have always been labor-intensive. Much of the time and energy required is devoted to collecting sufficient data to build general representative samples and occupation samples.
This effort was greatly reduced for the Strong 244 assessment by increased use of the Internet. Online completion of the assessment allows for dynamic demographic questions and simplified collection of detailed demographic information, greatly reducing the need for additional data collection. As a result, we were able to build a massive new General Representative Sample (GRS) of 100,000 people, and hundreds of new occupation and major samples.
The GRS is intended to represent the working population of the United States. To be included in the GRS, respondents must:
- Have identified their country of residence as the United States (or omitted a response; most Strong respondents reside in the United States).
- Have been working full time (85% of the GRS) or part time (15%).
- Have been at least 18 years old.
- Have been at least somewhat satisfied with their general line of work.
The GRS was built to be diverse with respect to gender, age, ethnicity, educational attainment, and occupation category. See the remainder of this chapter for a detailed demographic breakdown of the GRS.
The US Bureau of Labor Statistics was the primary source of information used to create targets for representing the US labor force. Specific tables used included:
- For full- and part-time workers
- For age
- For race and Hispanic ethnicity
- For educational attainment
- For occupation category
Demographic profile of the GRS: Gender
The GRS is evenly split between male and female respondents. See Table 1.1.
In addition, the gender question that we ask of respondents was altered in 2020 to include non-binary responses. As data accumulates, we intend to add more analyses related to respondents reporting non-binary gender identities.
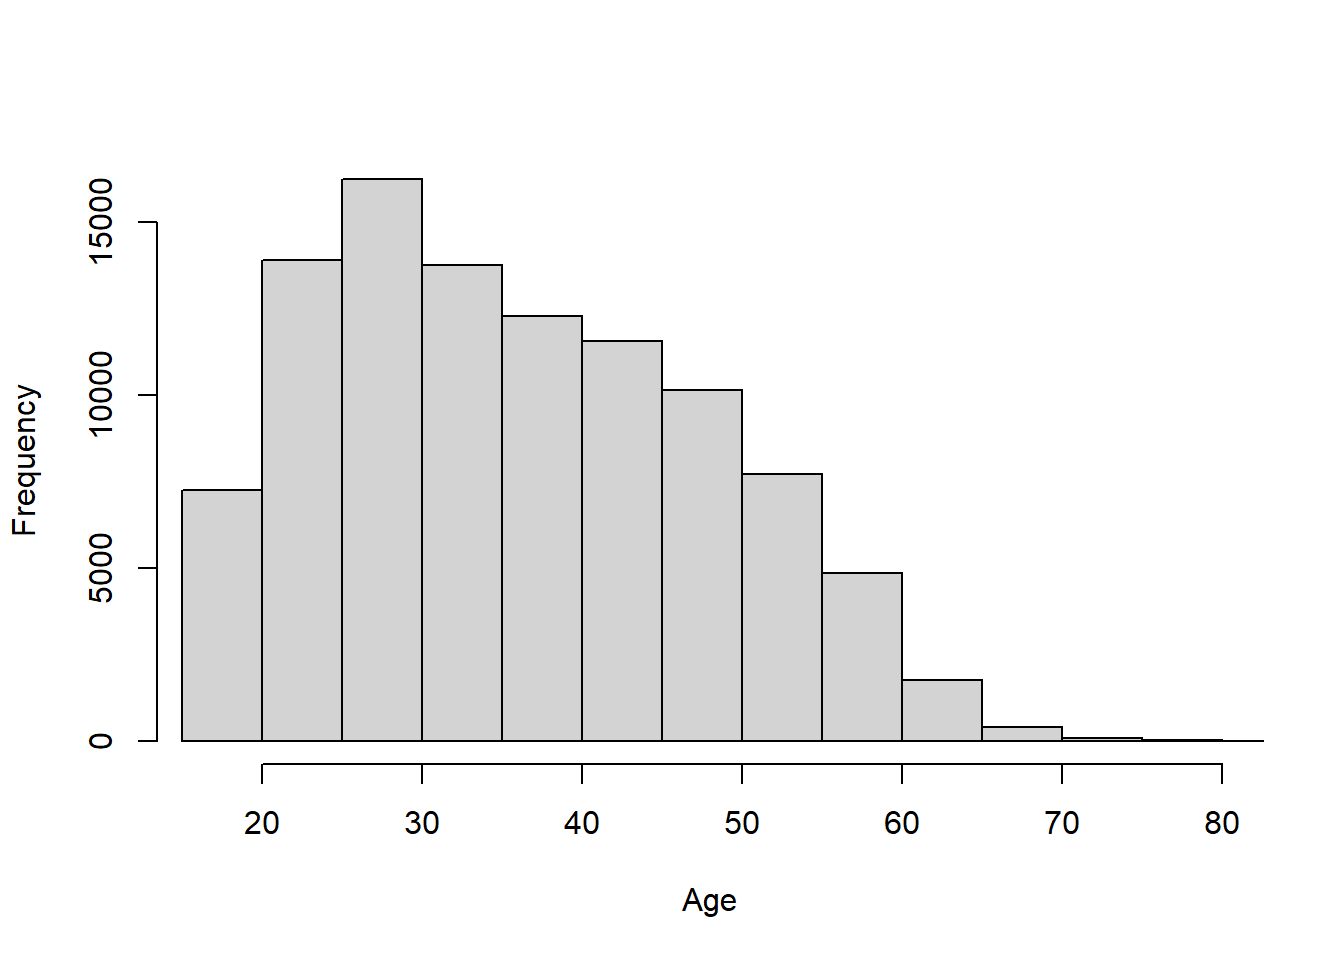
Demographic profile of the GRS: Age
The average age of the GRS is 36.5. The vast majority of respondents in the GRS are 20–60 years old. See Figure 1.1).
Demographic profile of the GRS: Ethnicity
Respondents indicated their ethnic backgrounds by responding to a series of checkboxes. To view the distribution for ethnicity, see Table 1.2. Percentages sum to over 100 because respondents were able to select multiple ethnicities.
| Ethnicity | n | percent |
|---|---|---|
| Asian | 4,297 | 4 |
| Black | 7,139 | 7 |
| Hispanic | 11,257 | 11 |
| Indian | 969 | 1 |
| Middle Eastern | 970 | 1 |
| Native American | 6,784 | 7 |
| Other | 2,008 | 2 |
| Pacific Islander | 543 | 1 |
| White | 69,891 | 70 |
Demographic profile of the GRS: Education
See Table Table 1.3 for the distribution of education level in the GRS.
| Level of education completed | n | percent |
|---|---|---|
| Some high school | 949 | 1 |
| High school diploma | 11,061 | 11 |
| Trade technical training | 2,645 | 3 |
| Some college, no degree | 25,051 | 25 |
| Associate degree | 8,863 | 9 |
| Bachelor’s degree | 28,727 | 29 |
| Master’s degree | 17,084 | 17 |
| Professional degree, MD | 2,030 | 2 |
| Doctorate, PhD | 3,232 | 3 |
Demographic profile of the GRS: Occupation
See Table Table 1.4 for the distribution of occupation category in the GRS.
| Employed respondents occupation category | n | percent |
|---|---|---|
| Architecture and engineering | 2,247 | 2 |
| Arts, design, entertainment, sports, and media | 2,977 | 3 |
| Building and grounds cleaning and maintenance | 929 | 1 |
| Business and financial operations | 10,975 | 11 |
| Community and social services | 5,478 | 5 |
| Computer and mathematical occupations | 4,216 | 4 |
| Construction and extraction occupations | 1,605 | 2 |
| Education, training, and library occupations | 11,888 | 12 |
| Farming, fishing, and forestry | 420 | 0 |
| Food preparation and food service | 6,049 | 6 |
| Healthcare practitioner and technical occupations | 3,790 | 4 |
| Healthcare support occupations | 3,802 | 4 |
| Installation, maintenance, and repair occupations | 2,225 | 2 |
| Legal | 1,659 | 2 |
| Life, physical, and social sciences | 2,365 | 2 |
| Management | 9,189 | 9 |
| Military specific occupations | 1,928 | 2 |
| Office and administrative support | 8,949 | 9 |
| Personal care and personal service | 2,511 | 3 |
| Production occupations | 2,494 | 2 |
| Protective services | 1,850 | 2 |
| Sales and related occupations | 9,910 | 10 |
| Transportation and materials moving | 1,867 | 2 |
Brennan, M. D. (2009). The effect of career assessments and follow-up counseling on career decision-making self-efficacy (CDMSE) among active-duty coast guard personnel. Unpublished Dissertation.
Case, J., & Blackwell, T. L. (2008). Test review. Rehabilitation Counseling Bulletin. https://doi.org/10.1177/0034355207311350
Donnay, D. A. C., Morris, M. L., Schaubhut, N. A., & Thompson, R. C. (2005). Strong interest inventory manual: Research, development, and strategies for interpretation. CPP, Inc.
Harris, K. L., & Rottinghaus, P. J. (2015). Vocational interest and personal style patterns: Exploring subjective well-being using the strong interest inventory. Journal of Career Assessment. https://doi.org/10.1177/1069072715621009
Luzzo, D. A., & Day, M. A. (1999). Effects of strong interest inventory feedback on career decision-making self-efficacy and social cognitive career beliefs. Journal of Career Assessment. https://doi.org/10.1177/106907279900700101
Morris, M. A. (2003). A meta-analytic investigation of vocational interest-based job fit, and its relationship to job satisfaction, performance, and turnover. Unpublished Manuscript. https://www.proquest.com/openview/a1b0f15b91c8df75ba1eccf819d393f5/1?pq-origsite=gscholar&cbl=18750&diss=y
Nye, C. D., & Prasad, J., J. J.and Rounds. (2021). The effects of vocational interests on motivation, satisfaction, and academic performance: Test of a mediated model. Journal of Vocational Behavior. https://doi.org/10.1016/j.jvb.2021.103583
Nye, C. D., Prasad, J. J., Bradburn, J. C., & Elizondo, F. (2018). Improving the operationalization of interest congruence using polynomial regression. Journal of Vocational Behavior. https://doi.org/10.1016/j.jvb.2017.10.012
Nye, C. D., Su, R., Rounds, J., & Drasgow, F. (2012). Vocational interests and performance: A quantitative summary of over 60 years of research. Perspectives on Psychological Science. https://doi.org/10.1177/1745691612449021
Prediger, D. J. (1982). Dimensions underlying holland’s hexagon: Missing link between interests and occupations? Journal of Vocational Behavior. https://doi.org/10.1016/0001-8791(82)90036-7
Strong, E. K. Jr. (1955). Vocational interests 18 years after college. University of Minnesota Press. https://www.jstor.org/stable/10.5749/j.cttts3zq
Su, R. (2012). The power of vocational interests and interest congruence in predicting career success. Unpusblished Dissertation. https://www.proquest.com/openview/d7728566db969b66f3cb8583437ba99a/1?pq-origsite=gscholar&cbl=18750
Su, R., Rounds, J., & Armstrong, P. I. (2009). Men and things, women and people: A meta-analysis of sex differences in interests. Psychological Bulletin. https://doi.org/10.1037/a0017364