Chapter 6 Occupation Satisfaction Predictions
Direct prediction of satisfaction in hundreds of occupations is a new feature to the Strong 244 assessment. While it will take time and feedback from users to gauge its usefulness and best practices, we expect that this will be a welcome and important new set of results for respondents and practitioners.
6.1 Use of satisfaction and similarity scores for occupations
With the introduction of satisfaction scores, there are now two scores for each occupation for practitioners and respondents to consider. How can someone best use these two scores together? Which score should practitioners rely on more?
Here is some general guidance for respondents and practitioners:
- We expect that the use of these two sets of scores will evolve over time. With this in mind, recommendations for how to use satisfaction scores will likely be updated periodically.
- We recommend that practitioners pay particular attention to occupations have both high similarity and satisfaction scores. The Career Satisfaction Report indicates “Top” occupations that are in the top 25% of occupations for both similarity and satisfaction (three stars in the Top column), followed by occupations that are in the top 25% for similarity but not satisfaction (two stars in the Top column), followed by occupations that are in the top 25% for satisfaction but not similarity (one star in the Top column), followed by occupations that are not in the top 25% for either similarity or satisfaction (no stars). Within each of these groups, occupations are sorted in descending order by similarity score. The top 25% of similarity and satisfaction scores is calculated for each respondent.
- Because similarity scores have a long history of use, and will likely be more familiar to Strong practitioners, we recommend relying more on similarity scores for occupation recommendations, and leaning more on similarity scores when similarity and satisfaction scores point in different directions. This is reflected in the “Top” occupation order described above.
6.2 Strong’s thoughts on using interests to predict satisfaction
(Strong, 1955) described his reluctance to use satisfaction as a criterion to judge interest measures: “One of the explanations is that satisfaction pertaining to occupational activity is not a distinct entity, separate from satisfaction associated with the physical and social environment surrounding the job…[people] may like [their] work but exhibit great dissatisfaction because of poor health or trouble with [a partner] or children; or [they] may like [their] work but not the place in which [they] have to live or some of the people with whom [they have] to associate.” (both page 98)
Nonetheless, (Strong, 1955) remarked that “Despite these objections the writer can think of no better criterion for a vocational interest test than that of satisfaction enduring over a period of time.” (page 12)
6.3 Satisfaction score computation
Satisfaction scores are new to the Strong 244 assessment. These scores complement the similarity scores that have been part of the Strong assessment since its creation in 1927.
Satisfaction scores are produced for each occupation by running an ordinal logistic regression with 30 carryover Basic Interest Scales as predictors of satisfaction (Note: The Conservation & Environmentalism and Hospitality & Tourism scales are not included). Satisfaction is measured with a single item (“How satisfied are you with your general line of work?”) and responses are made on a six-point Likert-type scale (“very satisfied” to “very dissatisfied”). Because satisfaction ratings are generally skewed toward more satisfied responses, we collapsed all three dissatisfied response options (“somewhat dissatisfied”, “dissatisfied”, and “very dissatisfied”) into a single “dissatisfied” category. As a result, the models are set up to predict the likelihood of being “very satisfied”, “satisfied”, “somewhat satisfied”, and “dissatisfied”.
There were a minimum of 200 people in each occupation sample.
The advantage of using this approach is that each respondent can see for their interests, the likelihood of being in each satisfaction category. Satisfaction summary scores are computed for each occupation for each respondent by summing the “very satisfied” and “satisfied” probabilities.
6.4 Reliability
For test-retest reliability of the satisfaction summary scores and descriptives from the GRS, see Table 6.1.
GRS means show that there is great variability in predicted satisfaction across occupations. This is primarily the result of actual satisfaction varying greatly by occupation (e.g., CEOs are more satisfied in general than telemarketers).
| Occupation | Satisfaction model N | Retest short | Retest long | GRS min | GRS max | GRS mean | GRS sd |
|---|---|---|---|---|---|---|---|
| Accountants and Auditors | 4731 | 0.79 | 0.77 | 0.01 | 0.95 | 0.26 | 0.16 |
| Actors | 406 | 0.88 | 0.81 | 0.04 | 0.94 | 0.39 | 0.12 |
| Administrative Services Managers | 1113 | 0.78 | 0.74 | 0.01 | 0.98 | 0.40 | 0.17 |
| Adult Basic Education, Adult Secondary Education, and English as a Second Language Instructors | 427 | 0.83 | 0.74 | 0.02 | 0.99 | 0.58 | 0.18 |
| Advertising Sales Agents | 770 | 0.79 | 0.79 | 0.00 | 0.94 | 0.23 | 0.14 |
| Aerospace Engineers | 273 | 0.76 | 0.71 | 0.00 | 1.00 | 0.41 | 0.21 |
| Agents and Business Managers of Artists, Performers, and Athletes | 391 | 0.77 | 0.75 | 0.01 | 0.97 | 0.51 | 0.17 |
| Aircraft Mechanics and Service Technicians | 264 | 0.82 | 0.81 | 0.00 | 1.00 | 0.29 | 0.20 |
| Animal Caretakers | 451 | 0.84 | 0.75 | 0.02 | 0.96 | 0.42 | 0.12 |
| Appraisers and Assessors of Real Estate | 211 | 0.87 | 0.78 | 0.00 | 1.00 | 0.41 | 0.18 |
| Architects, Except Landscape and Naval | 280 | 0.88 | 0.78 | 0.00 | 0.99 | 0.35 | 0.18 |
| Art Directors | 241 | 0.71 | 0.77 | 0.03 | 0.98 | 0.52 | 0.14 |
| Art, Drama, and Music Teachers, Postsecondary | 228 | 0.73 | 0.76 | 0.00 | 1.00 | 0.49 | 0.21 |
| Athletes and Sports Competitors | 401 | 0.84 | 0.68 | 0.04 | 1.00 | 0.66 | 0.14 |
| Automotive Body and Related Repairers | 205 | 0.77 | 0.56 | 0.00 | 1.00 | 0.24 | 0.21 |
| Automotive Service Technicians and Mechanics | 292 | 0.75 | 0.71 | 0.00 | 1.00 | 0.27 | 0.18 |
| Baristas | 2775 | 0.83 | 0.80 | 0.04 | 0.89 | 0.39 | 0.11 |
| Bartenders | 2499 | 0.84 | 0.84 | 0.02 | 0.77 | 0.28 | 0.09 |
| Bill and Account Collectors | 417 | 0.89 | 0.80 | 0.00 | 0.97 | 0.24 | 0.15 |
| Biochemists and Biophysicists | 263 | 0.86 | 0.74 | 0.00 | 1.00 | 0.13 | 0.17 |
| Biological Technicians | 200 | 0.76 | 0.83 | 0.00 | 1.00 | 0.22 | 0.17 |
| Biologists | 560 | 0.77 | 0.77 | 0.00 | 0.98 | 0.18 | 0.15 |
| Bookkeeping, Accounting, and Auditing Clerks | 1058 | 0.80 | 0.75 | 0.00 | 0.98 | 0.23 | 0.15 |
| Budget Analysts | 334 | 0.88 | 0.73 | 0.00 | 1.00 | 0.40 | 0.23 |
| Bus Drivers, School | 234 | 0.79 | 0.71 | 0.00 | 1.00 | 0.29 | 0.20 |
| Bus Drivers, Transit and Intercity | 211 | 0.84 | 0.73 | 0.00 | 0.98 | 0.32 | 0.17 |
| Business Teachers, Postsecondary | 341 | 0.81 | 0.66 | 0.09 | 0.99 | 0.72 | 0.13 |
| Career/Technical Education Teachers, Middle School | 237 | 0.79 | 0.71 | 0.01 | 1.00 | 0.63 | 0.20 |
| Career/Technical Education Teachers, Postsecondary | 394 | 0.78 | 0.79 | 0.04 | 0.99 | 0.78 | 0.12 |
| Career/Technical Education Teachers, Secondary School | 953 | 0.87 | 0.81 | 0.13 | 0.98 | 0.75 | 0.10 |
| Carpenters | 259 | 0.90 | 0.74 | 0.00 | 1.00 | 0.19 | 0.17 |
| Cashiers | 18496 | 0.79 | 0.72 | 0.03 | 0.85 | 0.28 | 0.10 |
| Chefs and Head Cooks | 832 | 0.82 | 0.75 | 0.01 | 0.92 | 0.26 | 0.13 |
| Chemists | 279 | 0.78 | 0.69 | 0.00 | 1.00 | 0.18 | 0.17 |
| Chief Executives | 1509 | 0.81 | 0.79 | 0.18 | 0.98 | 0.72 | 0.09 |
| Child, Family, and School Social Workers | 1196 | 0.81 | 0.72 | 0.02 | 0.97 | 0.45 | 0.13 |
| Childcare Workers | 3090 | 0.83 | 0.81 | 0.02 | 0.97 | 0.40 | 0.15 |
| Civil Engineers | 350 | 0.78 | 0.82 | 0.00 | 1.00 | 0.23 | 0.20 |
| Claims Adjusters, Examiners, and Investigators | 835 | 0.81 | 0.71 | 0.02 | 0.94 | 0.37 | 0.14 |
| Clergy | 1011 | 0.87 | 0.79 | 0.01 | 0.99 | 0.33 | 0.20 |
| Clinical and Counseling Psychologists | 1220 | 0.85 | 0.86 | 0.03 | 0.99 | 0.61 | 0.17 |
| Coaches and Scouts | 830 | 0.83 | 0.76 | 0.08 | 0.96 | 0.53 | 0.12 |
| Compensation, Benefits, and Job Analysis Specialists | 674 | 0.76 | 0.75 | 0.00 | 0.99 | 0.42 | 0.19 |
| Computer Programmers | 921 | 0.89 | 0.86 | 0.00 | 0.98 | 0.23 | 0.18 |
| Computer Systems Analysts | 1163 | 0.85 | 0.87 | 0.00 | 0.99 | 0.31 | 0.18 |
| Computer User Support Specialists | 1944 | 0.88 | 0.85 | 0.00 | 0.98 | 0.27 | 0.16 |
| Computer and Information Research Scientists | 289 | 0.82 | 0.78 | 0.00 | 0.99 | 0.40 | 0.21 |
| Computer and Information Systems Managers | 1022 | 0.86 | 0.81 | 0.00 | 1.00 | 0.41 | 0.20 |
| Concierges | 219 | 0.85 | 0.87 | 0.00 | 0.99 | 0.33 | 0.19 |
| Construction Laborers | 717 | 0.78 | 0.81 | 0.00 | 0.95 | 0.23 | 0.13 |
| Construction Managers | 468 | 0.80 | 0.80 | 0.00 | 0.99 | 0.32 | 0.19 |
| Cooks, Fast Food | 3950 | 0.79 | 0.73 | 0.02 | 0.78 | 0.24 | 0.08 |
| Cooks, Institution and Cafeteria | 275 | 0.70 | 0.75 | 0.00 | 0.96 | 0.27 | 0.15 |
| Cooks, Restaurant | 1594 | 0.75 | 0.74 | 0.01 | 0.95 | 0.25 | 0.12 |
| Cooks, Short Order | 570 | 0.71 | 0.73 | 0.00 | 0.90 | 0.25 | 0.12 |
| Correctional Officers and Jailers | 304 | 0.80 | 0.80 | 0.00 | 0.98 | 0.19 | 0.12 |
| Counter and Rental Clerks | 2053 | 0.82 | 0.78 | 0.01 | 0.86 | 0.26 | 0.11 |
| Court Reporters and Simultaneous Captioners | 240 | 0.80 | 0.79 | 0.00 | 1.00 | 0.30 | 0.19 |
| Craft Artists | 284 | 0.82 | 0.77 | 0.00 | 0.99 | 0.46 | 0.19 |
| Credit Analysts | 362 | 0.82 | 0.81 | 0.00 | 0.99 | 0.31 | 0.17 |
| Customer Service Representatives | 4195 | 0.82 | 0.76 | 0.02 | 0.86 | 0.28 | 0.12 |
| Dancers | 445 | 0.88 | 0.81 | 0.02 | 0.99 | 0.47 | 0.14 |
| Data Entry Keyers | 1285 | 0.84 | 0.79 | 0.01 | 0.89 | 0.25 | 0.12 |
| Database Administrators | 354 | 0.83 | 0.86 | 0.00 | 0.99 | 0.38 | 0.20 |
| Demonstrators and Product Promoters | 268 | 0.78 | 0.71 | 0.00 | 0.99 | 0.33 | 0.16 |
| Dental Assistants | 565 | 0.84 | 0.78 | 0.00 | 0.97 | 0.28 | 0.15 |
| Detectives and Criminal Investigators | 224 | 0.82 | 0.76 | 0.00 | 1.00 | 0.41 | 0.22 |
| Dining Room and Cafeteria Attendants and Bartender Helpers | 937 | 0.79 | 0.65 | 0.02 | 0.92 | 0.31 | 0.12 |
| Directors, Religious Activities and Education | 457 | 0.91 | 0.78 | 0.00 | 1.00 | 0.29 | 0.25 |
| Dishwashers | 1839 | 0.79 | 0.64 | 0.01 | 0.86 | 0.29 | 0.10 |
| Driver/Sales Workers | 534 | 0.80 | 0.75 | 0.00 | 0.84 | 0.22 | 0.10 |
| Editors | 545 | 0.82 | 0.87 | 0.00 | 0.89 | 0.23 | 0.12 |
| Education Administrators, Kindergarten through Secondary | 402 | 0.83 | 0.80 | 0.01 | 0.99 | 0.49 | 0.20 |
| Education Administrators, Postsecondary | 2548 | 0.81 | 0.74 | 0.02 | 0.99 | 0.64 | 0.14 |
| Education Teachers, Postsecondary | 923 | 0.79 | 0.70 | 0.06 | 0.99 | 0.69 | 0.12 |
| Education and Childcare Administrators, Preschool and Daycare | 300 | 0.81 | 0.66 | 0.00 | 0.99 | 0.45 | 0.22 |
| Educational, Guidance, and Career Counselors and Advisors | 2881 | 0.87 | 0.76 | 0.05 | 0.98 | 0.64 | 0.15 |
| Electrical Engineers | 498 | 0.80 | 0.76 | 0.00 | 0.98 | 0.34 | 0.17 |
| Electricians | 279 | 0.78 | 0.74 | 0.00 | 0.99 | 0.24 | 0.18 |
| Elementary School Teachers, Except Special Education | 2702 | 0.85 | 0.71 | 0.00 | 0.99 | 0.29 | 0.22 |
| Emergency Medical Technicians | 349 | 0.89 | 0.77 | 0.00 | 0.97 | 0.29 | 0.16 |
| English Language and Literature Teachers, Postsecondary | 363 | 0.79 | 0.76 | 0.00 | 0.98 | 0.41 | 0.19 |
| Environmental Scientists and Specialists, Including Health | 228 | 0.77 | 0.78 | 0.00 | 0.99 | 0.44 | 0.20 |
| Executive Secretaries and Executive Administrative Assistants | 7345 | 0.75 | 0.81 | 0.00 | 0.98 | 0.25 | 0.18 |
| Exercise Trainers and Group Fitness Instructors | 881 | 0.84 | 0.75 | 0.01 | 0.97 | 0.40 | 0.13 |
| Farmworkers and Laborers, Crop, Nursery, and Greenhouse | 325 | 0.80 | 0.73 | 0.00 | 0.98 | 0.32 | 0.17 |
| Farmworkers, Farm, Ranch, and Aquacultural Animals | 371 | 0.85 | 0.73 | 0.00 | 0.98 | 0.36 | 0.19 |
| Fashion Designers | 206 | 0.75 | 0.53 | 0.00 | 1.00 | 0.45 | 0.21 |
| Fast Food and Counter Workers | 10577 | 0.83 | 0.67 | 0.04 | 0.73 | 0.28 | 0.07 |
| File Clerks | 660 | 0.84 | 0.78 | 0.00 | 0.97 | 0.23 | 0.14 |
| Film and Video Editors | 246 | 0.84 | 0.79 | 0.01 | 0.99 | 0.40 | 0.16 |
| Financial Examiners | 342 | 0.83 | 0.78 | 0.02 | 0.97 | 0.51 | 0.16 |
| Financial Managers | 1546 | 0.80 | 0.78 | 0.02 | 0.98 | 0.47 | 0.17 |
| Financial Risk Specialists | 380 | 0.79 | 0.80 | 0.01 | 0.99 | 0.41 | 0.16 |
| Financial and Investment Analysts | 2292 | 0.79 | 0.81 | 0.00 | 0.98 | 0.32 | 0.17 |
| Fine Artists, Including Painters, Sculptors, and Illustrators | 362 | 0.76 | 0.62 | 0.02 | 0.97 | 0.41 | 0.14 |
| First-Line Supervisors of Construction Trades and Extraction Workers | 415 | 0.75 | 0.81 | 0.00 | 1.00 | 0.28 | 0.19 |
| First-Line Supervisors of Food Preparation and Serving Workers | 2678 | 0.87 | 0.77 | 0.02 | 0.91 | 0.30 | 0.11 |
| First-Line Supervisors of Material-Moving Machine and Vehicle Operators | 353 | 0.86 | 0.77 | 0.01 | 1.00 | 0.36 | 0.18 |
| First-Line Supervisors of Mechanics, Installers, and Repairers | 420 | 0.78 | 0.68 | 0.00 | 1.00 | 0.47 | 0.20 |
| First-Line Supervisors of Non-Retail Sales Workers | 382 | 0.79 | 0.70 | 0.00 | 0.99 | 0.38 | 0.19 |
| First-Line Supervisors of Office and Administrative Support Workers | 2046 | 0.85 | 0.77 | 0.03 | 0.97 | 0.42 | 0.16 |
| First-Line Supervisors of Personal Service Workers | 241 | 0.81 | 0.69 | 0.01 | 0.99 | 0.45 | 0.18 |
| First-Line Supervisors of Production and Operating Workers | 914 | 0.83 | 0.75 | 0.01 | 0.98 | 0.42 | 0.17 |
| First-Line Supervisors of Retail Sales Workers | 1827 | 0.79 | 0.77 | 0.01 | 0.94 | 0.25 | 0.13 |
| Food Preparation Workers | 1720 | 0.76 | 0.72 | 0.02 | 0.81 | 0.31 | 0.09 |
| Food Servers, Nonrestaurant | 2053 | 0.88 | 0.82 | 0.04 | 0.84 | 0.32 | 0.09 |
| Food Service Managers | 978 | 0.87 | 0.83 | 0.01 | 0.91 | 0.24 | 0.11 |
| Fraud Examiners, Investigators and Analysts | 624 | 0.74 | 0.84 | 0.02 | 0.97 | 0.43 | 0.15 |
| Fundraisers | 221 | 0.68 | 0.79 | 0.00 | 1.00 | 0.33 | 0.21 |
| Gambling Change Persons and Booth Cashiers | 238 | 0.67 | 0.56 | 0.00 | 1.00 | 0.41 | 0.20 |
| General and Operations Managers | 3577 | 0.85 | 0.79 | 0.04 | 0.96 | 0.50 | 0.14 |
| Graphic Designers | 989 | 0.73 | 0.74 | 0.01 | 0.89 | 0.32 | 0.13 |
| Hairdressers, Hairstylists, and Cosmetologists | 1273 | 0.81 | 0.84 | 0.01 | 0.92 | 0.36 | 0.12 |
| Health Education Specialists | 253 | 0.75 | 0.60 | 0.00 | 1.00 | 0.46 | 0.21 |
| Heavy and Tractor-Trailer Truck Drivers | 394 | 0.75 | 0.84 | 0.00 | 0.98 | 0.23 | 0.14 |
| Helpers–Installation, Maintenance, and Repair Workers | 406 | 0.77 | 0.64 | 0.01 | 0.87 | 0.28 | 0.12 |
| Home Health Aides | 1769 | 0.82 | 0.82 | 0.02 | 0.89 | 0.35 | 0.11 |
| Hosts and Hostesses, Restaurant, Lounge, and Coffee Shop | 4176 | 0.83 | 0.73 | 0.03 | 0.88 | 0.35 | 0.09 |
| Hotel, Motel, and Resort Desk Clerks | 417 | 0.73 | 0.65 | 0.00 | 0.99 | 0.26 | 0.16 |
| Human Resources Assistants, Except Payroll and Timekeeping | 1728 | 0.83 | 0.79 | 0.01 | 0.98 | 0.39 | 0.17 |
| Human Resources Managers | 1416 | 0.79 | 0.79 | 0.00 | 0.99 | 0.45 | 0.21 |
| Human Resources Specialists | 886 | 0.86 | 0.80 | 0.02 | 0.97 | 0.44 | 0.16 |
| Infantry | 355 | 0.86 | 0.80 | 0.00 | 0.99 | 0.21 | 0.15 |
| Information Technology Project Managers | 414 | 0.88 | 0.79 | 0.00 | 0.99 | 0.36 | 0.20 |
| Inspectors, Testers, Sorters, Samplers, and Weighers | 248 | 0.70 | 0.67 | 0.00 | 0.99 | 0.22 | 0.17 |
| Instructional Coordinators | 1224 | 0.81 | 0.78 | 0.11 | 0.96 | 0.55 | 0.12 |
| Insurance Claims and Policy Processing Clerks | 714 | 0.85 | 0.70 | 0.00 | 0.98 | 0.28 | 0.14 |
| Insurance Sales Agents | 1455 | 0.75 | 0.78 | 0.00 | 0.97 | 0.27 | 0.19 |
| Insurance Underwriters | 493 | 0.76 | 0.73 | 0.01 | 0.99 | 0.40 | 0.17 |
| Interior Designers | 246 | 0.78 | 0.80 | 0.00 | 0.99 | 0.34 | 0.19 |
| Janitors and Cleaners, Except Maids and Housekeeping Cleaners | 1744 | 0.84 | 0.72 | 0.02 | 0.75 | 0.24 | 0.07 |
| Judges, Magistrate Judges, and Magistrates | 1735 | 0.81 | 0.83 | 0.00 | 0.98 | 0.24 | 0.15 |
| Kindergarten Teachers, Except Special Education | 321 | 0.84 | 0.75 | 0.00 | 1.00 | 0.29 | 0.22 |
| Laborers and Freight, Stock, and Material Movers, Hand | 901 | 0.79 | 0.71 | 0.02 | 0.80 | 0.25 | 0.09 |
| Landscaping and Groundskeeping Workers | 1035 | 0.88 | 0.83 | 0.01 | 0.91 | 0.28 | 0.13 |
| Lawyers | 2317 | 0.77 | 0.79 | 0.00 | 0.96 | 0.16 | 0.15 |
| Librarians and Media Collections Specialists | 802 | 0.71 | 0.67 | 0.06 | 0.94 | 0.54 | 0.11 |
| Library Technicians | 604 | 0.84 | 0.84 | 0.01 | 0.97 | 0.41 | 0.16 |
| Licensed Practical and Licensed Vocational Nurses | 489 | 0.87 | 0.75 | 0.00 | 0.98 | 0.31 | 0.19 |
| Lifeguards, Ski Patrol, and Other Recreational Protective Service Workers | 587 | 0.85 | 0.70 | 0.01 | 0.95 | 0.46 | 0.12 |
| Light Truck Drivers | 773 | 0.83 | 0.76 | 0.03 | 0.78 | 0.25 | 0.08 |
| Loan Officers | 877 | 0.85 | 0.82 | 0.01 | 0.92 | 0.24 | 0.11 |
| Logisticians | 224 | 0.81 | 0.78 | 0.01 | 0.98 | 0.41 | 0.18 |
| Machinists | 313 | 0.82 | 0.81 | 0.00 | 0.92 | 0.15 | 0.12 |
| Maids and Housekeeping Cleaners | 746 | 0.81 | 0.55 | 0.01 | 0.81 | 0.25 | 0.09 |
| Maintenance and Repair Workers, General | 427 | 0.87 | 0.82 | 0.00 | 0.98 | 0.28 | 0.17 |
| Management Analysts | 1090 | 0.84 | 0.74 | 0.01 | 0.97 | 0.43 | 0.16 |
| Market Research Analysts and Marketing Specialists | 490 | 0.75 | 0.78 | 0.01 | 0.98 | 0.37 | 0.17 |
| Marketing Managers | 2128 | 0.85 | 0.79 | 0.00 | 0.98 | 0.34 | 0.18 |
| Massage Therapists | 234 | 0.78 | 0.76 | 0.00 | 0.99 | 0.44 | 0.20 |
| Mechanical Engineers | 794 | 0.86 | 0.86 | 0.00 | 0.97 | 0.32 | 0.18 |
| Media Programming Directors | 709 | 0.81 | 0.75 | 0.02 | 0.99 | 0.61 | 0.16 |
| Medical Assistants | 1462 | 0.88 | 0.78 | 0.01 | 0.93 | 0.32 | 0.13 |
| Medical Scientists, Except Epidemiologists | 220 | 0.85 | 0.75 | 0.00 | 0.98 | 0.32 | 0.19 |
| Medical Secretaries and Administrative Assistants | 471 | 0.72 | 0.67 | 0.00 | 0.99 | 0.16 | 0.15 |
| Medical Transcriptionists | 221 | 0.74 | 0.74 | 0.00 | 0.99 | 0.32 | 0.20 |
| Medical and Clinical Laboratory Technicians | 429 | 0.85 | 0.80 | 0.00 | 0.99 | 0.29 | 0.19 |
| Medical and Clinical Laboratory Technologists | 209 | 0.78 | 0.71 | 0.00 | 0.99 | 0.26 | 0.19 |
| Medical and Health Services Managers | 444 | 0.77 | 0.69 | 0.02 | 0.99 | 0.60 | 0.16 |
| Meeting, Convention, and Event Planners | 277 | 0.82 | 0.81 | 0.00 | 1.00 | 0.47 | 0.21 |
| Mental Health Counselors | 1559 | 0.85 | 0.76 | 0.01 | 0.98 | 0.43 | 0.19 |
| Mental Health and Substance Abuse Social Workers | 507 | 0.82 | 0.79 | 0.00 | 0.99 | 0.30 | 0.20 |
| Middle School Teachers, Except Special and Career/Technical Education | 1402 | 0.83 | 0.71 | 0.00 | 1.00 | 0.33 | 0.23 |
| Models | 206 | 0.76 | 0.76 | 0.00 | 0.99 | 0.42 | 0.18 |
| Musicians and Singers | 588 | 0.83 | 0.71 | 0.01 | 0.96 | 0.33 | 0.14 |
| Nannies | 1508 | 0.85 | 0.76 | 0.01 | 0.94 | 0.38 | 0.13 |
| Network and Computer Systems Administrators | 536 | 0.80 | 0.80 | 0.00 | 1.00 | 0.24 | 0.20 |
| News Analysts, Reporters, and Journalists | 268 | 0.82 | 0.82 | 0.00 | 0.99 | 0.19 | 0.16 |
| Nursing Assistants | 1137 | 0.88 | 0.70 | 0.01 | 0.98 | 0.33 | 0.14 |
| Office Clerks, General | 2446 | 0.80 | 0.79 | 0.01 | 0.94 | 0.29 | 0.14 |
| Orderlies | 2626 | 0.90 | 0.78 | 0.01 | 0.92 | 0.24 | 0.13 |
| Packaging and Filling Machine Operators and Tenders | 336 | 0.83 | 0.76 | 0.01 | 0.95 | 0.23 | 0.12 |
| Packers and Packagers, Hand | 471 | 0.81 | 0.69 | 0.00 | 0.94 | 0.25 | 0.13 |
| Painters, Construction and Maintenance | 296 | 0.85 | 0.83 | 0.00 | 0.99 | 0.19 | 0.15 |
| Parts Salespersons | 738 | 0.80 | 0.73 | 0.00 | 0.95 | 0.26 | 0.14 |
| Payroll and Timekeeping Clerks | 265 | 0.73 | 0.75 | 0.00 | 1.00 | 0.35 | 0.24 |
| Personal Care Aides | 1976 | 0.85 | 0.79 | 0.04 | 0.91 | 0.40 | 0.10 |
| Personal Financial Advisors | 1496 | 0.80 | 0.79 | 0.00 | 0.99 | 0.38 | 0.20 |
| Pharmacists | 265 | 0.70 | 0.74 | 0.00 | 1.00 | 0.44 | 0.22 |
| Pharmacy Aides | 653 | 0.79 | 0.73 | 0.03 | 0.87 | 0.34 | 0.10 |
| Pharmacy Technicians | 1121 | 0.79 | 0.80 | 0.01 | 0.93 | 0.32 | 0.13 |
| Photographers | 546 | 0.83 | 0.76 | 0.02 | 0.98 | 0.39 | 0.14 |
| Physical Therapist Aides | 230 | 0.81 | 0.75 | 0.00 | 1.00 | 0.36 | 0.18 |
| Physical Therapists | 301 | 0.86 | 0.73 | 0.00 | 0.99 | 0.34 | 0.18 |
| Police and Sheriff’s Patrol Officers | 511 | 0.82 | 0.75 | 0.00 | 1.00 | 0.22 | 0.17 |
| Preschool Teachers, Except Special Education | 2088 | 0.88 | 0.72 | 0.00 | 0.98 | 0.31 | 0.18 |
| Probation Officers and Correctional Treatment Specialists | 219 | 0.81 | 0.73 | 0.00 | 0.99 | 0.32 | 0.18 |
| Property, Real Estate, and Community Association Managers | 496 | 0.82 | 0.80 | 0.01 | 0.97 | 0.34 | 0.17 |
| Psychiatric Aides | 544 | 0.81 | 0.71 | 0.00 | 0.98 | 0.29 | 0.15 |
| Psychology Teachers, Postsecondary | 516 | 0.79 | 0.69 | 0.13 | 0.99 | 0.75 | 0.11 |
| Public Relations Managers | 344 | 0.83 | 0.73 | 0.00 | 1.00 | 0.43 | 0.21 |
| Public Relations Specialists | 746 | 0.79 | 0.76 | 0.00 | 0.99 | 0.34 | 0.17 |
| Purchasing Agents, Except Wholesale, Retail, and Farm Products | 564 | 0.79 | 0.72 | 0.01 | 0.99 | 0.46 | 0.18 |
| Purchasing Managers | 342 | 0.83 | 0.78 | 0.00 | 1.00 | 0.52 | 0.23 |
| Radiologic Technologists and Technicians | 205 | 0.83 | 0.63 | 0.00 | 1.00 | 0.44 | 0.21 |
| Real Estate Brokers | 284 | 0.85 | 0.60 | 0.00 | 1.00 | 0.23 | 0.16 |
| Real Estate Sales Agents | 970 | 0.77 | 0.77 | 0.00 | 0.94 | 0.19 | 0.12 |
| Receptionists and Information Clerks | 3041 | 0.79 | 0.76 | 0.01 | 0.95 | 0.30 | 0.16 |
| Recreation Workers | 544 | 0.76 | 0.66 | 0.04 | 0.96 | 0.50 | 0.13 |
| Registered Nurses | 1598 | 0.87 | 0.73 | 0.00 | 0.99 | 0.34 | 0.20 |
| Rehabilitation Counselors | 354 | 0.77 | 0.66 | 0.00 | 1.00 | 0.54 | 0.23 |
| Residential Advisors | 272 | 0.82 | 0.69 | 0.01 | 1.00 | 0.55 | 0.16 |
| Retail Salespersons | 19070 | 0.76 | 0.72 | 0.01 | 0.90 | 0.26 | 0.12 |
| Sales Engineers | 278 | 0.70 | 0.72 | 0.00 | 0.99 | 0.35 | 0.21 |
| Sales Managers | 1544 | 0.78 | 0.75 | 0.00 | 0.99 | 0.37 | 0.18 |
| Sales Representatives of Services, Except Advertising, Insurance, Financial Services, and Travel | 4474 | 0.76 | 0.76 | 0.01 | 0.94 | 0.29 | 0.13 |
| Sales Representatives, Wholesale and Manufacturing, Except Technical and Scientific Products | 1018 | 0.80 | 0.69 | 0.00 | 0.93 | 0.25 | 0.15 |
| Sales Representatives, Wholesale and Manufacturing, Technical and Scientific Products | 1142 | 0.72 | 0.71 | 0.00 | 0.93 | 0.25 | 0.14 |
| Secondary School Teachers, Except Special and Career/Technical Education | 2013 | 0.83 | 0.74 | 0.00 | 0.99 | 0.37 | 0.22 |
| Secretaries and Administrative Assistants, Except Legal, Medical, and Executive | 2721 | 0.77 | 0.75 | 0.01 | 0.97 | 0.25 | 0.17 |
| Securities, Commodities, and Financial Services Sales Agents | 989 | 0.77 | 0.81 | 0.01 | 0.97 | 0.34 | 0.16 |
| Security Guards | 2086 | 0.81 | 0.79 | 0.00 | 0.91 | 0.21 | 0.11 |
| Self-Enrichment Teachers | 404 | 0.88 | 0.77 | 0.01 | 0.99 | 0.50 | 0.18 |
| Shipping, Receiving, and Inventory Clerks | 217 | 0.83 | 0.80 | 0.00 | 0.99 | 0.21 | 0.15 |
| Skincare Specialists | 208 | 0.83 | 0.75 | 0.00 | 0.98 | 0.41 | 0.18 |
| Social Science Research Assistants | 323 | 0.84 | 0.74 | 0.00 | 0.99 | 0.36 | 0.20 |
| Social and Community Service Managers | 868 | 0.70 | 0.64 | 0.03 | 0.99 | 0.48 | 0.16 |
| Social and Human Service Assistants | 1834 | 0.80 | 0.73 | 0.04 | 0.95 | 0.43 | 0.12 |
| Software Developers | 1251 | 0.89 | 0.85 | 0.00 | 0.98 | 0.22 | 0.19 |
| Special Education Teachers, Elementary School | 202 | 0.80 | 0.61 | 0.00 | 1.00 | 0.21 | 0.23 |
| Substance Abuse and Behavioral Disorder Counselors | 863 | 0.79 | 0.74 | 0.02 | 0.99 | 0.47 | 0.19 |
| Switchboard Operators, Including Answering Service | 553 | 0.84 | 0.78 | 0.01 | 0.96 | 0.31 | 0.15 |
| Tank Car, Truck, and Ship Loaders | 216 | 0.84 | 0.71 | 0.00 | 1.00 | 0.34 | 0.20 |
| Tax Preparers | 319 | 0.53 | 0.58 | 0.00 | 0.99 | 0.17 | 0.17 |
| Taxi Drivers | 208 | 0.72 | 0.62 | 0.00 | 1.00 | 0.18 | 0.15 |
| Teaching Assistants, Postsecondary | 447 | 0.82 | 0.82 | 0.06 | 0.98 | 0.60 | 0.11 |
| Teaching Assistants, Preschool, Elementary, Middle, and Secondary School, Except Special Education | 3833 | 0.85 | 0.72 | 0.02 | 0.98 | 0.41 | 0.15 |
| Team Assemblers | 473 | 0.85 | 0.81 | 0.01 | 0.80 | 0.23 | 0.10 |
| Telecommunications Equipment Installers and Repairers, Except Line Installers | 220 | 0.82 | 0.74 | 0.00 | 0.99 | 0.23 | 0.17 |
| Telemarketers | 793 | 0.77 | 0.84 | 0.00 | 0.93 | 0.18 | 0.10 |
| Telephone Operators | 638 | 0.77 | 0.72 | 0.02 | 0.94 | 0.32 | 0.12 |
| Tellers | 299 | 0.74 | 0.78 | 0.00 | 0.96 | 0.30 | 0.15 |
| Tire Builders | 2104 | 0.81 | 0.76 | 0.01 | 0.66 | 0.22 | 0.08 |
| Training and Development Managers | 488 | 0.75 | 0.80 | 0.02 | 0.99 | 0.59 | 0.17 |
| Training and Development Specialists | 580 | 0.83 | 0.69 | 0.04 | 0.97 | 0.51 | 0.14 |
| Transportation, Storage, and Distribution Managers | 290 | 0.84 | 0.83 | 0.01 | 0.99 | 0.46 | 0.17 |
| Tutors | 1282 | 0.82 | 0.76 | 0.06 | 0.97 | 0.56 | 0.13 |
| Umpires, Referees, and Other Sports Officials | 266 | 0.78 | 0.73 | 0.01 | 0.99 | 0.55 | 0.18 |
| Veterinary Assistants and Laboratory Animal Caretakers | 317 | 0.83 | 0.72 | 0.01 | 0.97 | 0.40 | 0.15 |
| Veterinary Technologists and Technicians | 392 | 0.79 | 0.63 | 0.01 | 0.99 | 0.36 | 0.18 |
| Waiters and Waitresses | 15176 | 0.87 | 0.78 | 0.03 | 0.80 | 0.27 | 0.09 |
| Wholesale and Retail Buyers, Except Farm Products | 698 | 0.84 | 0.82 | 0.02 | 0.95 | 0.37 | 0.13 |
6.5 Validity
6.5.1 Distribution of scale weights
Each occupation has a unique set of BIS weights that predict satisfaction. Most BISs do not contribute much to predicting satisfaction in most occupations. We would expect the distribution of weights for a particular BIS across all occupations to center around zero, with some negative and some positive weights. This pattern is what we find, for example on BIS 1 (Mechanics & Construction), 6.1.
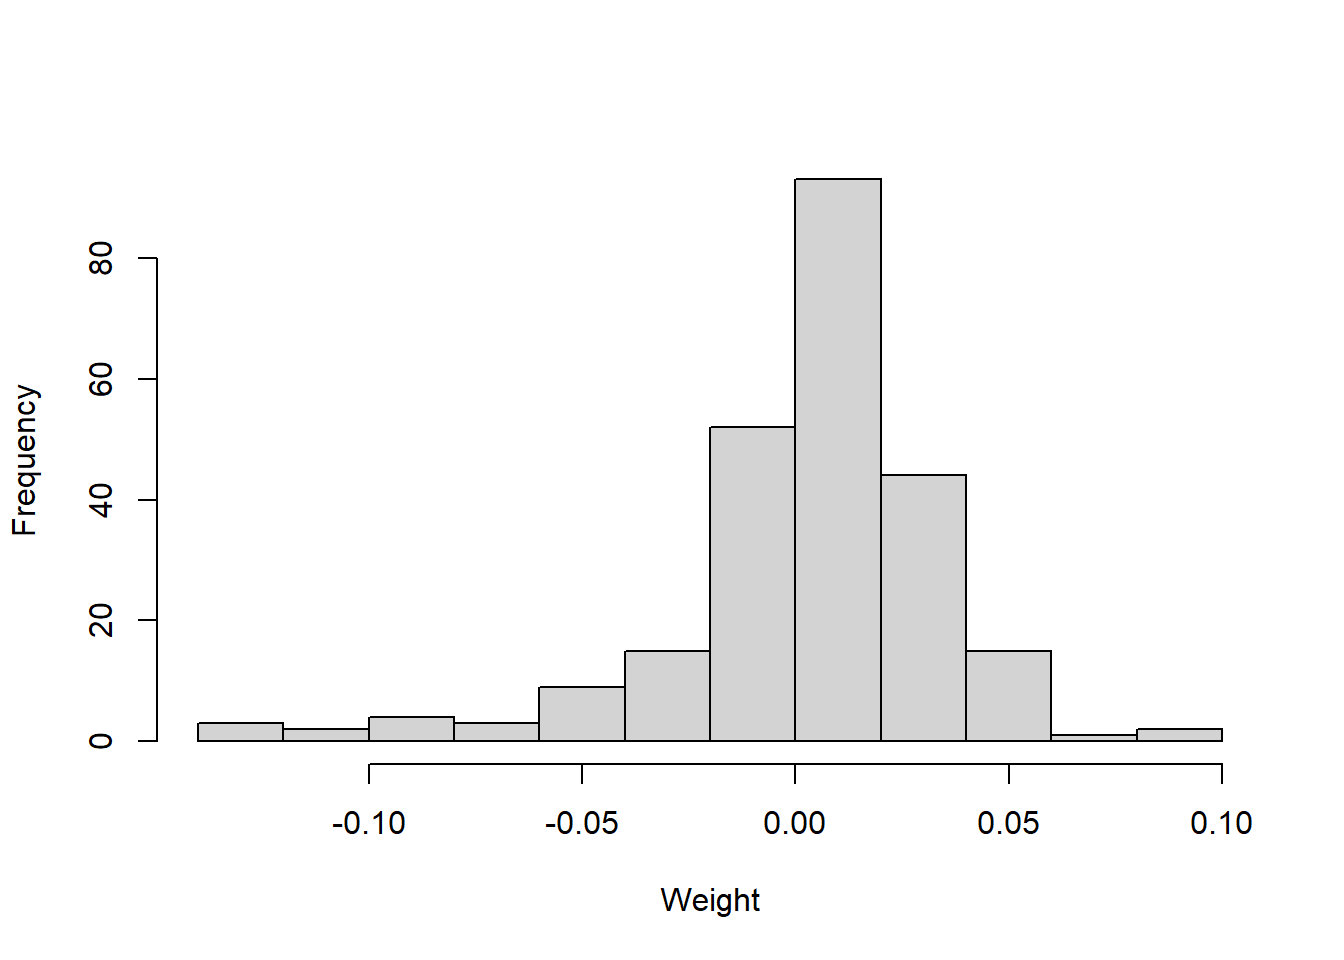
Figure 6.1: Distribution of weights for occupation satisfaction models: Mechanics & Construction BIS
6.5.2 Correlations with occupation similarity scores and GOTs
For correlations between the occupation satisfaction scores and occupation similarity scores, see Table 6.3. Correlations are generally positive (mean r = 0.31) but show that higher similarity does not necessarily indicate higher predicted satisfaction.
Correlations between each occupation satisfaction score and each GOT are also presented in Table 6.3.
| Occupation | r | Realistic | Investigative | Artistic | Social | Enterprising | Conventional |
|---|---|---|---|---|---|---|---|
| Accountants and Auditors | 0.61 | 0.20 | 0.15 | -0.12 | 0.04 | 0.22 | 0.76 |
| Actors | 0.20 | 0.20 | 0.00 | -0.12 | -0.02 | 0.12 | 0.04 |
| Administrative Services Managers | 0.23 | 0.22 | 0.12 | -0.04 | 0.14 | 0.18 | 0.57 |
| Adult Basic Education, Adult Secondary Education, and English as a Second Language Instructors | 0.35 | 0.02 | 0.05 | 0.29 | 0.73 | 0.24 | 0.11 |
| Advertising Sales Agents | 0.41 | 0.17 | 0.07 | -0.07 | -0.02 | 0.52 | 0.40 |
| Aerospace Engineers | 0.16 | 0.29 | 0.04 | -0.24 | -0.20 | -0.12 | 0.22 |
| Agents and Business Managers of Artists, Performers, and Athletes | 0.19 | 0.22 | 0.23 | -0.05 | -0.03 | 0.27 | 0.29 |
| Aircraft Mechanics and Service Technicians | 0.37 | 0.32 | 0.08 | -0.27 | -0.17 | -0.17 | 0.06 |
| Animal Caretakers | 0.09 | -0.20 | -0.26 | -0.25 | -0.06 | -0.07 | -0.23 |
| Appraisers and Assessors of Real Estate | 0.13 | -0.01 | -0.15 | -0.13 | -0.10 | 0.36 | 0.23 |
| Architects, Except Landscape and Naval | 0.19 | 0.32 | 0.08 | -0.11 | 0.00 | 0.32 | 0.29 |
| Art Directors | -0.03 | 0.01 | -0.16 | -0.07 | -0.08 | 0.17 | 0.13 |
| Art, Drama, and Music Teachers, Postsecondary | 0.15 | 0.13 | -0.03 | 0.15 | 0.39 | 0.11 | -0.24 |
| Athletes and Sports Competitors | 0.20 | 0.05 | -0.05 | 0.11 | 0.05 | -0.06 | -0.05 |
| Automotive Body and Related Repairers | 0.35 | 0.02 | -0.23 | -0.20 | -0.18 | 0.03 | -0.09 |
| Automotive Service Technicians and Mechanics | 0.29 | 0.19 | -0.21 | -0.31 | -0.10 | 0.07 | -0.06 |
| Baristas | 0.00 | -0.06 | -0.16 | -0.26 | 0.13 | 0.33 | 0.07 |
| Bartenders | 0.04 | -0.16 | -0.44 | -0.37 | 0.02 | 0.16 | 0.04 |
| Bill and Account Collectors | 0.32 | 0.07 | 0.01 | -0.26 | 0.10 | 0.12 | 0.59 |
| Biochemists and Biophysicists | 0.49 | 0.21 | 0.56 | 0.09 | 0.20 | 0.06 | 0.27 |
| Biological Technicians | 0.27 | 0.12 | 0.22 | -0.23 | -0.14 | -0.05 | -0.03 |
| Biologists | 0.61 | 0.37 | 0.71 | 0.14 | 0.04 | 0.08 | 0.22 |
| Bookkeeping, Accounting, and Auditing Clerks | 0.44 | 0.05 | 0.04 | -0.18 | 0.12 | 0.18 | 0.57 |
| Budget Analysts | 0.33 | 0.35 | 0.23 | -0.09 | 0.03 | 0.18 | 0.67 |
| Bus Drivers, School | 0.00 | -0.21 | -0.22 | -0.38 | -0.15 | -0.21 | -0.19 |
| Bus Drivers, Transit and Intercity | 0.07 | 0.16 | 0.22 | -0.07 | 0.19 | 0.12 | 0.10 |
| Business Teachers, Postsecondary | 0.20 | 0.40 | 0.44 | 0.34 | 0.45 | 0.43 | 0.49 |
| Career/Technical Education Teachers, Middle School | 0.24 | 0.01 | -0.06 | 0.16 | 0.42 | 0.11 | 0.05 |
| Career/Technical Education Teachers, Postsecondary | 0.40 | 0.15 | 0.26 | 0.37 | 0.58 | 0.33 | 0.18 |
| Career/Technical Education Teachers, Secondary School | 0.44 | -0.06 | 0.05 | 0.15 | 0.66 | 0.28 | 0.00 |
| Carpenters | 0.54 | 0.43 | 0.00 | -0.08 | -0.10 | 0.06 | 0.14 |
| Cashiers | 0.10 | -0.06 | -0.18 | -0.23 | 0.11 | 0.37 | 0.02 |
| Chefs and Head Cooks | 0.43 | 0.07 | -0.05 | 0.06 | 0.05 | 0.15 | 0.03 |
| Chemists | 0.59 | 0.31 | 0.53 | 0.10 | 0.03 | 0.06 | 0.11 |
| Chief Executives | 0.20 | 0.22 | 0.20 | -0.16 | 0.16 | 0.29 | 0.30 |
| Child, Family, and School Social Workers | 0.44 | -0.02 | -0.05 | 0.04 | 0.47 | -0.02 | 0.11 |
| Childcare Workers | 0.28 | -0.01 | -0.04 | -0.03 | 0.46 | 0.18 | -0.06 |
| Civil Engineers | 0.52 | 0.61 | 0.43 | 0.04 | -0.03 | 0.16 | 0.38 |
| Claims Adjusters, Examiners, and Investigators | 0.10 | 0.26 | 0.16 | -0.15 | 0.19 | 0.34 | 0.58 |
| Clergy | 0.83 | 0.12 | 0.16 | 0.30 | 0.58 | 0.30 | 0.18 |
| Clinical and Counseling Psychologists | 0.66 | 0.07 | 0.30 | 0.38 | 0.56 | 0.25 | 0.09 |
| Coaches and Scouts | 0.46 | -0.24 | -0.26 | -0.28 | 0.28 | -0.03 | -0.11 |
| Compensation, Benefits, and Job Analysis Specialists | 0.26 | 0.02 | 0.10 | 0.08 | 0.39 | 0.28 | 0.30 |
| Computer Programmers | 0.67 | 0.43 | 0.31 | 0.11 | 0.05 | 0.22 | 0.57 |
| Computer Systems Analysts | 0.50 | 0.35 | 0.30 | 0.09 | 0.07 | 0.14 | 0.55 |
| Computer User Support Specialists | 0.55 | 0.40 | 0.20 | -0.03 | 0.09 | 0.22 | 0.59 |
| Computer and Information Research Scientists | 0.41 | 0.50 | 0.40 | 0.06 | 0.10 | 0.22 | 0.42 |
| Computer and Information Systems Managers | 0.48 | 0.45 | 0.33 | 0.12 | 0.14 | 0.36 | 0.62 |
| Concierges | 0.27 | -0.15 | -0.28 | -0.22 | 0.07 | 0.13 | 0.06 |
| Construction Laborers | 0.44 | 0.23 | -0.13 | -0.37 | -0.37 | -0.20 | 0.18 |
| Construction Managers | 0.46 | 0.52 | 0.12 | -0.02 | 0.04 | 0.33 | 0.26 |
| Cooks, Fast Food | 0.02 | -0.20 | -0.22 | -0.25 | 0.07 | 0.05 | 0.16 |
| Cooks, Institution and Cafeteria | 0.18 | 0.18 | -0.07 | -0.10 | -0.14 | 0.02 | 0.05 |
| Cooks, Restaurant | 0.21 | -0.09 | -0.23 | -0.13 | -0.02 | 0.03 | -0.02 |
| Cooks, Short Order | 0.07 | -0.23 | -0.30 | -0.15 | 0.00 | -0.01 | -0.09 |
| Correctional Officers and Jailers | 0.56 | 0.08 | 0.02 | -0.01 | 0.22 | 0.06 | 0.22 |
| Counter and Rental Clerks | 0.22 | -0.01 | -0.16 | -0.29 | 0.15 | 0.44 | 0.21 |
| Court Reporters and Simultaneous Captioners | 0.32 | 0.06 | 0.09 | -0.28 | 0.02 | 0.12 | 0.38 |
| Craft Artists | 0.03 | 0.12 | -0.09 | -0.06 | 0.17 | 0.19 | 0.09 |
| Credit Analysts | 0.08 | 0.07 | 0.12 | -0.05 | 0.04 | 0.28 | 0.44 |
| Customer Service Representatives | 0.36 | 0.10 | 0.01 | -0.11 | 0.32 | 0.38 | 0.50 |
| Dancers | 0.34 | -0.07 | 0.03 | 0.26 | 0.38 | 0.19 | 0.08 |
| Data Entry Keyers | 0.33 | -0.07 | -0.14 | -0.15 | 0.11 | 0.07 | 0.39 |
| Database Administrators | 0.39 | 0.25 | 0.20 | -0.14 | -0.08 | 0.04 | 0.42 |
| Demonstrators and Product Promoters | 0.37 | -0.12 | -0.15 | -0.07 | 0.27 | 0.39 | 0.15 |
| Dental Assistants | 0.35 | 0.05 | 0.07 | -0.20 | -0.04 | -0.03 | 0.24 |
| Detectives and Criminal Investigators | 0.23 | 0.18 | 0.01 | -0.39 | -0.22 | -0.16 | 0.30 |
| Dining Room and Cafeteria Attendants and Bartender Helpers | 0.07 | 0.01 | -0.12 | -0.44 | -0.34 | -0.04 | -0.03 |
| Directors, Religious Activities and Education | 0.76 | 0.13 | 0.16 | 0.28 | 0.48 | 0.23 | 0.10 |
| Dishwashers | 0.06 | -0.08 | -0.20 | -0.28 | -0.06 | 0.00 | -0.06 |
| Driver/Sales Workers | 0.47 | 0.30 | -0.04 | -0.25 | -0.26 | 0.07 | 0.20 |
| Editors | 0.45 | -0.09 | -0.05 | 0.35 | 0.24 | 0.33 | 0.28 |
| Education Administrators, Kindergarten through Secondary | 0.50 | 0.22 | 0.18 | 0.28 | 0.71 | 0.30 | 0.15 |
| Education Administrators, Postsecondary | 0.32 | -0.04 | 0.10 | 0.14 | 0.60 | 0.36 | 0.16 |
| Education Teachers, Postsecondary | 0.23 | 0.22 | 0.17 | 0.21 | 0.37 | -0.01 | 0.12 |
| Education and Childcare Administrators, Preschool and Daycare | 0.28 | 0.31 | 0.22 | 0.26 | 0.64 | 0.35 | 0.20 |
| Educational, Guidance, and Career Counselors and Advisors | 0.62 | -0.04 | 0.05 | 0.37 | 0.74 | 0.31 | 0.05 |
| Electrical Engineers | 0.37 | 0.52 | 0.26 | -0.03 | 0.00 | 0.02 | 0.34 |
| Electricians | 0.50 | 0.50 | 0.15 | -0.14 | -0.05 | 0.05 | 0.26 |
| Elementary School Teachers, Except Special Education | 0.55 | 0.15 | 0.17 | 0.25 | 0.68 | 0.17 | 0.10 |
| Emergency Medical Technicians | 0.44 | 0.05 | 0.16 | -0.15 | 0.25 | -0.02 | 0.21 |
| English Language and Literature Teachers, Postsecondary | 0.41 | -0.05 | 0.20 | 0.29 | 0.72 | 0.19 | 0.20 |
| Environmental Scientists and Specialists, Including Health | -0.03 | 0.47 | 0.41 | 0.06 | 0.21 | 0.42 | 0.52 |
| Executive Secretaries and Executive Administrative Assistants | 0.45 | 0.01 | 0.02 | -0.03 | 0.20 | 0.14 | 0.39 |
| Exercise Trainers and Group Fitness Instructors | 0.35 | -0.13 | -0.10 | -0.10 | 0.19 | 0.04 | -0.12 |
| Farmworkers and Laborers, Crop, Nursery, and Greenhouse | 0.42 | 0.17 | 0.01 | -0.11 | 0.09 | 0.00 | -0.01 |
| Farmworkers, Farm, Ranch, and Aquacultural Animals | 0.47 | 0.48 | 0.29 | 0.22 | 0.04 | 0.12 | 0.12 |
| Fashion Designers | 0.17 | -0.10 | -0.13 | 0.04 | 0.04 | 0.08 | 0.07 |
| Fast Food and Counter Workers | -0.06 | -0.01 | -0.11 | -0.31 | 0.09 | 0.21 | 0.00 |
| File Clerks | 0.37 | -0.20 | -0.08 | -0.19 | -0.02 | -0.14 | 0.21 |
| Film and Video Editors | 0.05 | 0.20 | -0.02 | 0.05 | 0.06 | 0.29 | 0.24 |
| Financial Examiners | 0.14 | 0.37 | 0.28 | -0.05 | 0.17 | 0.36 | 0.60 |
| Financial Managers | 0.43 | 0.29 | 0.15 | -0.16 | 0.07 | 0.30 | 0.70 |
| Financial Risk Specialists | -0.10 | 0.16 | 0.10 | -0.15 | 0.04 | 0.18 | 0.51 |
| Financial and Investment Analysts | 0.35 | 0.24 | 0.18 | -0.12 | 0.12 | 0.28 | 0.76 |
| Fine Artists, Including Painters, Sculptors, and Illustrators | 0.24 | -0.28 | -0.24 | 0.08 | 0.20 | 0.06 | -0.23 |
| First-Line Supervisors of Construction Trades and Extraction Workers | 0.56 | 0.39 | 0.04 | -0.13 | 0.12 | 0.27 | 0.24 |
| First-Line Supervisors of Food Preparation and Serving Workers | 0.19 | -0.09 | -0.15 | -0.18 | 0.25 | 0.46 | 0.01 |
| First-Line Supervisors of Material-Moving Machine and Vehicle Operators | 0.24 | 0.18 | 0.05 | -0.11 | 0.27 | 0.34 | 0.26 |
| First-Line Supervisors of Mechanics, Installers, and Repairers | 0.23 | 0.36 | 0.08 | -0.04 | 0.27 | 0.29 | 0.33 |
| First-Line Supervisors of Non-Retail Sales Workers | 0.21 | 0.11 | 0.01 | -0.06 | 0.22 | 0.52 | 0.28 |
| First-Line Supervisors of Office and Administrative Support Workers | 0.27 | 0.20 | 0.04 | -0.10 | 0.21 | 0.23 | 0.50 |
| First-Line Supervisors of Personal Service Workers | 0.24 | 0.13 | 0.13 | 0.00 | 0.31 | 0.04 | 0.09 |
| First-Line Supervisors of Production and Operating Workers | 0.22 | 0.27 | 0.08 | -0.24 | 0.07 | 0.14 | 0.25 |
| First-Line Supervisors of Retail Sales Workers | 0.46 | 0.04 | -0.12 | -0.09 | 0.20 | 0.58 | 0.29 |
| Food Preparation Workers | -0.05 | -0.08 | -0.12 | -0.21 | 0.05 | 0.24 | 0.17 |
| Food Servers, Nonrestaurant | 0.20 | -0.16 | -0.27 | -0.30 | 0.16 | 0.11 | -0.10 |
| Food Service Managers | 0.41 | 0.03 | -0.19 | -0.14 | 0.16 | 0.41 | 0.23 |
| Fraud Examiners, Investigators and Analysts | 0.19 | 0.34 | 0.37 | 0.19 | 0.29 | 0.41 | 0.65 |
| Fundraisers | 0.18 | -0.19 | 0.09 | 0.19 | 0.14 | 0.18 | 0.10 |
| Gambling Change Persons and Booth Cashiers | 0.07 | 0.12 | 0.03 | 0.05 | 0.05 | 0.27 | 0.15 |
| General and Operations Managers | 0.33 | 0.34 | 0.18 | 0.01 | 0.35 | 0.61 | 0.56 |
| Graphic Designers | 0.32 | 0.10 | 0.01 | 0.18 | -0.07 | 0.36 | 0.15 |
| Hairdressers, Hairstylists, and Cosmetologists | 0.28 | 0.06 | -0.17 | -0.11 | 0.01 | 0.25 | 0.03 |
| Health Education Specialists | 0.15 | -0.04 | -0.03 | 0.20 | 0.41 | 0.20 | 0.00 |
| Heavy and Tractor-Trailer Truck Drivers | 0.32 | 0.13 | -0.24 | -0.47 | -0.35 | -0.17 | 0.05 |
| Helpers–Installation, Maintenance, and Repair Workers | 0.35 | 0.03 | -0.17 | -0.28 | -0.14 | -0.03 | -0.05 |
| Home Health Aides | 0.41 | 0.18 | 0.18 | -0.05 | 0.35 | 0.17 | 0.12 |
| Hosts and Hostesses, Restaurant, Lounge, and Coffee Shop | 0.10 | -0.11 | -0.19 | -0.34 | 0.07 | 0.11 | -0.05 |
| Hotel, Motel, and Resort Desk Clerks | 0.25 | 0.05 | -0.02 | -0.19 | -0.01 | 0.21 | 0.18 |
| Human Resources Assistants, Except Payroll and Timekeeping | 0.33 | 0.04 | 0.06 | 0.01 | 0.27 | 0.27 | 0.35 |
| Human Resources Managers | 0.49 | 0.24 | 0.22 | 0.26 | 0.46 | 0.52 | 0.34 |
| Human Resources Specialists | 0.31 | 0.10 | 0.08 | 0.08 | 0.39 | 0.47 | 0.27 |
| Infantry | 0.61 | 0.29 | 0.17 | -0.03 | 0.10 | 0.10 | 0.17 |
| Information Technology Project Managers | 0.30 | 0.38 | 0.29 | 0.05 | 0.18 | 0.33 | 0.63 |
| Inspectors, Testers, Sorters, Samplers, and Weighers | 0.29 | 0.21 | 0.16 | -0.16 | 0.00 | 0.08 | 0.42 |
| Instructional Coordinators | 0.24 | -0.02 | 0.02 | 0.13 | 0.65 | 0.30 | 0.35 |
| Insurance Claims and Policy Processing Clerks | 0.34 | 0.01 | 0.05 | -0.18 | 0.06 | 0.18 | 0.44 |
| Insurance Sales Agents | 0.50 | 0.35 | 0.20 | 0.16 | 0.28 | 0.71 | 0.49 |
| Insurance Underwriters | 0.00 | 0.21 | 0.04 | -0.08 | 0.02 | 0.29 | 0.58 |
| Interior Designers | 0.15 | 0.10 | -0.02 | 0.21 | 0.01 | 0.21 | -0.13 |
| Janitors and Cleaners, Except Maids and Housekeeping Cleaners | 0.05 | 0.18 | -0.05 | -0.19 | 0.00 | 0.07 | 0.01 |
| Judges, Magistrate Judges, and Magistrates | 0.37 | 0.11 | 0.13 | -0.07 | 0.10 | 0.13 | 0.44 |
| Kindergarten Teachers, Except Special Education | 0.42 | 0.23 | 0.16 | 0.20 | 0.65 | 0.28 | 0.22 |
| Laborers and Freight, Stock, and Material Movers, Hand | 0.18 | 0.00 | -0.17 | -0.28 | -0.13 | -0.04 | 0.03 |
| Landscaping and Groundskeeping Workers | 0.40 | 0.37 | 0.05 | -0.29 | -0.07 | 0.01 | 0.18 |
| Lawyers | 0.49 | 0.26 | 0.25 | 0.13 | 0.24 | 0.33 | 0.34 |
| Librarians and Media Collections Specialists | -0.19 | 0.16 | 0.10 | 0.02 | 0.35 | 0.14 | 0.36 |
| Library Technicians | 0.02 | -0.28 | -0.29 | -0.29 | 0.15 | -0.18 | 0.14 |
| Licensed Practical and Licensed Vocational Nurses | 0.54 | 0.23 | 0.23 | 0.08 | 0.33 | 0.15 | 0.21 |
| Lifeguards, Ski Patrol, and Other Recreational Protective Service Workers | 0.20 | 0.10 | 0.10 | -0.06 | 0.38 | 0.26 | 0.06 |
| Light Truck Drivers | 0.19 | 0.14 | -0.15 | -0.25 | 0.00 | 0.20 | 0.21 |
| Loan Officers | 0.30 | -0.13 | -0.26 | -0.17 | 0.02 | 0.31 | 0.37 |
| Logisticians | 0.00 | 0.02 | 0.02 | -0.08 | 0.03 | 0.21 | 0.43 |
| Machinists | 0.44 | 0.55 | 0.17 | -0.13 | -0.10 | 0.13 | 0.35 |
| Maids and Housekeeping Cleaners | -0.14 | 0.16 | 0.04 | -0.06 | 0.10 | 0.40 | 0.19 |
| Maintenance and Repair Workers, General | 0.42 | 0.44 | 0.14 | -0.20 | -0.14 | 0.03 | 0.06 |
| Management Analysts | 0.12 | 0.25 | 0.28 | -0.03 | 0.04 | 0.32 | 0.61 |
| Market Research Analysts and Marketing Specialists | 0.28 | 0.18 | 0.22 | 0.09 | 0.09 | 0.49 | 0.36 |
| Marketing Managers | 0.40 | 0.25 | 0.17 | 0.06 | 0.17 | 0.61 | 0.43 |
| Massage Therapists | 0.08 | 0.04 | -0.31 | -0.15 | -0.04 | -0.05 | 0.06 |
| Mechanical Engineers | 0.56 | 0.66 | 0.33 | 0.01 | -0.15 | 0.18 | 0.29 |
| Media Programming Directors | 0.25 | 0.19 | 0.36 | 0.29 | 0.66 | 0.44 | 0.28 |
| Medical Assistants | 0.55 | 0.17 | 0.31 | -0.01 | 0.15 | 0.07 | 0.27 |
| Medical Scientists, Except Epidemiologists | 0.40 | 0.38 | 0.59 | 0.19 | 0.16 | 0.08 | 0.20 |
| Medical Secretaries and Administrative Assistants | 0.53 | -0.05 | 0.06 | -0.15 | 0.16 | 0.08 | 0.25 |
| Medical Transcriptionists | 0.15 | 0.11 | 0.16 | -0.10 | 0.09 | 0.11 | 0.26 |
| Medical and Clinical Laboratory Technicians | 0.47 | 0.33 | 0.42 | 0.04 | 0.15 | 0.13 | 0.23 |
| Medical and Clinical Laboratory Technologists | 0.27 | 0.28 | 0.38 | 0.01 | 0.29 | 0.22 | 0.34 |
| Medical and Health Services Managers | 0.08 | 0.12 | 0.13 | 0.18 | 0.23 | 0.13 | 0.26 |
| Meeting, Convention, and Event Planners | -0.11 | 0.21 | 0.06 | 0.04 | 0.21 | 0.33 | 0.37 |
| Mental Health Counselors | 0.73 | 0.08 | 0.18 | 0.42 | 0.66 | 0.21 | -0.03 |
| Mental Health and Substance Abuse Social Workers | 0.68 | -0.02 | 0.08 | 0.22 | 0.56 | 0.11 | -0.09 |
| Middle School Teachers, Except Special and Career/Technical Education | 0.50 | 0.10 | 0.11 | 0.21 | 0.68 | 0.14 | 0.10 |
| Models | 0.09 | -0.26 | -0.19 | -0.16 | 0.15 | 0.24 | -0.01 |
| Musicians and Singers | 0.54 | 0.09 | -0.04 | 0.38 | 0.16 | 0.18 | 0.00 |
| Nannies | 0.32 | -0.06 | -0.10 | -0.18 | 0.31 | 0.07 | 0.02 |
| Network and Computer Systems Administrators | 0.64 | 0.42 | 0.21 | -0.03 | -0.02 | 0.15 | 0.50 |
| News Analysts, Reporters, and Journalists | 0.44 | -0.01 | -0.05 | 0.37 | 0.10 | 0.22 | -0.08 |
| Nursing Assistants | 0.48 | 0.14 | 0.40 | 0.02 | 0.19 | -0.02 | 0.07 |
| Office Clerks, General | 0.36 | -0.05 | -0.13 | -0.22 | 0.11 | 0.08 | 0.25 |
| Orderlies | 0.59 | 0.24 | 0.31 | 0.02 | 0.27 | 0.09 | 0.16 |
| Packaging and Filling Machine Operators and Tenders | 0.31 | 0.02 | -0.13 | -0.30 | -0.14 | -0.11 | 0.06 |
| Packers and Packagers, Hand | 0.15 | 0.05 | -0.07 | -0.25 | 0.08 | 0.14 | 0.15 |
| Painters, Construction and Maintenance | 0.51 | 0.42 | -0.01 | -0.30 | -0.12 | 0.09 | 0.18 |
| Parts Salespersons | 0.41 | 0.03 | -0.11 | -0.31 | 0.01 | 0.34 | 0.21 |
| Payroll and Timekeeping Clerks | 0.28 | -0.09 | -0.22 | -0.31 | -0.11 | -0.02 | 0.32 |
| Personal Care Aides | 0.09 | 0.04 | 0.03 | -0.21 | 0.16 | 0.03 | -0.11 |
| Personal Financial Advisors | 0.50 | 0.39 | 0.30 | 0.10 | 0.30 | 0.66 | 0.58 |
| Pharmacists | 0.23 | 0.04 | 0.24 | -0.12 | 0.24 | 0.15 | 0.15 |
| Pharmacy Aides | 0.25 | -0.11 | 0.07 | -0.38 | -0.03 | 0.12 | 0.14 |
| Pharmacy Technicians | 0.28 | -0.08 | 0.15 | -0.31 | 0.07 | 0.17 | 0.18 |
| Photographers | 0.28 | -0.26 | -0.29 | 0.05 | -0.13 | 0.14 | -0.12 |
| Physical Therapist Aides | 0.22 | -0.08 | 0.14 | 0.09 | 0.44 | 0.14 | 0.25 |
| Physical Therapists | 0.28 | 0.08 | 0.21 | -0.04 | 0.27 | -0.04 | -0.16 |
| Police and Sheriff’s Patrol Officers | 0.69 | 0.41 | 0.27 | 0.05 | 0.16 | 0.10 | 0.34 |
| Preschool Teachers, Except Special Education | 0.43 | 0.14 | 0.11 | 0.09 | 0.61 | 0.19 | 0.09 |
| Probation Officers and Correctional Treatment Specialists | 0.33 | 0.11 | 0.20 | 0.21 | 0.26 | -0.01 | 0.00 |
| Property, Real Estate, and Community Association Managers | 0.30 | 0.18 | -0.01 | -0.19 | 0.26 | 0.41 | 0.43 |
| Psychiatric Aides | 0.67 | -0.07 | 0.04 | 0.24 | 0.49 | 0.12 | -0.11 |
| Psychology Teachers, Postsecondary | 0.20 | 0.04 | 0.08 | -0.09 | 0.11 | -0.10 | -0.17 |
| Public Relations Managers | 0.20 | 0.30 | 0.05 | 0.06 | 0.15 | 0.39 | 0.43 |
| Public Relations Specialists | 0.25 | 0.15 | 0.03 | 0.18 | 0.12 | 0.40 | 0.32 |
| Purchasing Agents, Except Wholesale, Retail, and Farm Products | -0.02 | 0.13 | 0.03 | -0.18 | -0.06 | 0.27 | 0.56 |
| Purchasing Managers | 0.06 | 0.15 | -0.01 | -0.40 | -0.03 | 0.19 | 0.43 |
| Radiologic Technologists and Technicians | 0.10 | 0.32 | 0.23 | 0.01 | 0.29 | 0.23 | 0.29 |
| Real Estate Brokers | 0.24 | -0.10 | -0.09 | -0.26 | 0.08 | 0.26 | 0.23 |
| Real Estate Sales Agents | 0.38 | 0.18 | 0.07 | 0.09 | 0.24 | 0.61 | 0.34 |
| Receptionists and Information Clerks | 0.39 | -0.01 | 0.01 | -0.06 | 0.19 | 0.18 | 0.36 |
| Recreation Workers | 0.17 | -0.03 | 0.04 | 0.18 | 0.35 | 0.09 | -0.10 |
| Registered Nurses | 0.43 | 0.21 | 0.24 | 0.03 | 0.38 | 0.16 | 0.20 |
| Rehabilitation Counselors | 0.33 | 0.23 | 0.24 | 0.27 | 0.59 | 0.47 | 0.18 |
| Residential Advisors | 0.10 | 0.04 | -0.03 | 0.09 | 0.19 | 0.15 | -0.18 |
| Retail Salespersons | 0.29 | -0.05 | -0.18 | -0.21 | 0.03 | 0.42 | 0.08 |
| Sales Engineers | 0.26 | 0.06 | 0.05 | -0.07 | 0.26 | 0.50 | 0.30 |
| Sales Managers | 0.59 | 0.33 | 0.14 | 0.07 | 0.21 | 0.66 | 0.45 |
| Sales Representatives of Services, Except Advertising, Insurance, Financial Services, and Travel | 0.26 | 0.06 | -0.02 | -0.18 | 0.02 | 0.42 | 0.21 |
| Sales Representatives, Wholesale and Manufacturing, Except Technical and Scientific Products | 0.42 | 0.11 | -0.02 | -0.13 | 0.00 | 0.51 | 0.30 |
| Sales Representatives, Wholesale and Manufacturing, Technical and Scientific Products | 0.43 | 0.14 | -0.06 | -0.11 | -0.05 | 0.41 | 0.17 |
| Secondary School Teachers, Except Special and Career/Technical Education | 0.50 | 0.09 | 0.12 | 0.24 | 0.75 | 0.23 | 0.09 |
| Secretaries and Administrative Assistants, Except Legal, Medical, and Executive | 0.50 | 0.00 | 0.04 | 0.02 | 0.22 | 0.14 | 0.31 |
| Securities, Commodities, and Financial Services Sales Agents | 0.39 | 0.20 | 0.08 | 0.11 | 0.29 | 0.64 | 0.51 |
| Security Guards | 0.52 | 0.26 | 0.07 | -0.13 | 0.10 | 0.18 | 0.20 |
| Self-Enrichment Teachers | 0.30 | -0.03 | -0.03 | 0.20 | 0.65 | 0.30 | 0.01 |
| Shipping, Receiving, and Inventory Clerks | 0.28 | 0.10 | -0.08 | -0.36 | 0.05 | 0.15 | 0.33 |
| Skincare Specialists | 0.11 | 0.09 | -0.06 | -0.25 | -0.02 | 0.23 | 0.14 |
| Social Science Research Assistants | 0.09 | -0.08 | 0.21 | -0.03 | 0.10 | -0.11 | 0.18 |
| Social and Community Service Managers | 0.27 | 0.02 | 0.23 | 0.10 | 0.54 | 0.10 | 0.23 |
| Social and Human Service Assistants | 0.30 | 0.12 | 0.00 | 0.00 | 0.53 | 0.26 | 0.15 |
| Software Developers | 0.71 | 0.43 | 0.38 | 0.14 | 0.12 | 0.25 | 0.59 |
| Special Education Teachers, Elementary School | 0.46 | -0.12 | -0.02 | 0.07 | 0.44 | -0.03 | 0.01 |
| Substance Abuse and Behavioral Disorder Counselors | 0.67 | 0.14 | 0.20 | 0.21 | 0.63 | 0.40 | 0.20 |
| Switchboard Operators, Including Answering Service | 0.31 | 0.07 | -0.15 | -0.14 | 0.08 | 0.29 | 0.32 |
| Tank Car, Truck, and Ship Loaders | -0.05 | -0.36 | -0.35 | -0.21 | 0.13 | -0.02 | 0.01 |
| Tax Preparers | 0.68 | 0.22 | 0.16 | -0.04 | 0.13 | 0.23 | 0.62 |
| Taxi Drivers | 0.17 | 0.06 | -0.03 | -0.17 | 0.01 | 0.08 | -0.04 |
| Teaching Assistants, Postsecondary | 0.31 | -0.21 | -0.11 | 0.08 | 0.54 | 0.31 | -0.04 |
| Teaching Assistants, Preschool, Elementary, Middle, and Secondary School, Except Special Education | 0.33 | 0.09 | 0.06 | 0.05 | 0.52 | 0.11 | 0.03 |
| Team Assemblers | 0.26 | 0.22 | -0.11 | -0.25 | -0.12 | 0.03 | 0.16 |
| Telecommunications Equipment Installers and Repairers, Except Line Installers | 0.51 | 0.41 | 0.12 | -0.08 | -0.11 | 0.06 | 0.44 |
| Telemarketers | 0.34 | -0.18 | -0.26 | -0.25 | 0.05 | 0.21 | 0.12 |
| Telephone Operators | 0.23 | -0.09 | -0.12 | -0.27 | -0.08 | 0.15 | 0.20 |
| Tellers | 0.16 | -0.02 | -0.06 | 0.01 | 0.14 | 0.35 | 0.27 |
| Tire Builders | 0.17 | 0.14 | -0.09 | -0.33 | -0.09 | -0.05 | 0.15 |
| Training and Development Managers | 0.20 | 0.21 | 0.30 | 0.37 | 0.41 | 0.42 | 0.27 |
| Training and Development Specialists | 0.41 | -0.01 | -0.02 | 0.25 | 0.49 | 0.38 | 0.12 |
| Transportation, Storage, and Distribution Managers | 0.23 | 0.04 | 0.03 | -0.35 | 0.03 | 0.03 | 0.11 |
| Tutors | 0.05 | 0.01 | 0.09 | -0.02 | 0.49 | 0.00 | 0.04 |
| Umpires, Referees, and Other Sports Officials | 0.23 | 0.10 | 0.09 | -0.02 | 0.16 | 0.17 | 0.19 |
| Veterinary Assistants and Laboratory Animal Caretakers | 0.16 | 0.18 | 0.40 | -0.04 | 0.20 | 0.18 | 0.24 |
| Veterinary Technologists and Technicians | 0.21 | 0.07 | 0.29 | 0.03 | 0.19 | 0.11 | 0.21 |
| Waiters and Waitresses | 0.14 | -0.16 | -0.30 | -0.37 | 0.10 | 0.17 | 0.04 |
| Wholesale and Retail Buyers, Except Farm Products | 0.19 | 0.19 | -0.05 | -0.14 | 0.07 | 0.39 | 0.45 |
6.5.3 Group differences
6.5.3.1 Gender
Gender differences on each occupation satisfaction scale are shows in Table 6.5.
| Occupation | Female mean | Female SD | Male mean | Male SD | d |
|---|---|---|---|---|---|
| Accountants and Auditors | 0.26 | 0.17 | 0.27 | 0.15 | -0.06 |
| Actors | 0.37 | 0.12 | 0.41 | 0.11 | -0.35 |
| Administrative Services Managers | 0.41 | 0.18 | 0.40 | 0.16 | 0.06 |
| Adult Basic Education, Adult Secondary Education, and English as a Second Language Instructors | 0.60 | 0.18 | 0.57 | 0.17 | 0.17 |
| Advertising Sales Agents | 0.22 | 0.14 | 0.25 | 0.13 | -0.22 |
| Aerospace Engineers | 0.36 | 0.20 | 0.47 | 0.20 | -0.55 |
| Agents and Business Managers of Artists, Performers, and Athletes | 0.48 | 0.18 | 0.54 | 0.16 | -0.35 |
| Aircraft Mechanics and Service Technicians | 0.26 | 0.19 | 0.33 | 0.21 | -0.35 |
| Animal Caretakers | 0.42 | 0.12 | 0.41 | 0.12 | 0.08 |
| Appraisers and Assessors of Real Estate | 0.40 | 0.19 | 0.41 | 0.18 | -0.05 |
| Architects, Except Landscape and Naval | 0.31 | 0.18 | 0.38 | 0.18 | -0.39 |
| Art Directors | 0.51 | 0.15 | 0.53 | 0.13 | -0.14 |
| Art, Drama, and Music Teachers, Postsecondary | 0.47 | 0.21 | 0.51 | 0.20 | -0.20 |
| Athletes and Sports Competitors | 0.66 | 0.14 | 0.66 | 0.14 | 0.00 |
| Automotive Body and Related Repairers | 0.22 | 0.20 | 0.26 | 0.21 | -0.20 |
| Automotive Service Technicians and Mechanics | 0.23 | 0.16 | 0.31 | 0.19 | -0.46 |
| Baristas | 0.38 | 0.11 | 0.39 | 0.10 | -0.10 |
| Bartenders | 0.28 | 0.09 | 0.28 | 0.09 | 0.00 |
| Bill and Account Collectors | 0.26 | 0.16 | 0.23 | 0.13 | 0.21 |
| Biochemists and Biophysicists | 0.14 | 0.17 | 0.13 | 0.16 | 0.06 |
| Biological Technicians | 0.21 | 0.17 | 0.23 | 0.18 | -0.11 |
| Biologists | 0.16 | 0.14 | 0.20 | 0.15 | -0.28 |
| Bookkeeping, Accounting, and Auditing Clerks | 0.24 | 0.17 | 0.22 | 0.13 | 0.13 |
| Budget Analysts | 0.38 | 0.23 | 0.42 | 0.22 | -0.18 |
| Bus Drivers, School | 0.29 | 0.21 | 0.29 | 0.19 | 0.00 |
| Bus Drivers, Transit and Intercity | 0.31 | 0.17 | 0.32 | 0.16 | -0.06 |
| Business Teachers, Postsecondary | 0.70 | 0.13 | 0.74 | 0.12 | -0.32 |
| Career/Technical Education Teachers, Middle School | 0.64 | 0.20 | 0.61 | 0.20 | 0.15 |
| Career/Technical Education Teachers, Postsecondary | 0.79 | 0.12 | 0.78 | 0.11 | 0.09 |
| Career/Technical Education Teachers, Secondary School | 0.76 | 0.10 | 0.75 | 0.10 | 0.10 |
| Carpenters | 0.13 | 0.13 | 0.24 | 0.19 | -0.68 |
| Cashiers | 0.28 | 0.10 | 0.28 | 0.09 | 0.00 |
| Chefs and Head Cooks | 0.27 | 0.13 | 0.26 | 0.12 | 0.08 |
| Chemists | 0.15 | 0.16 | 0.20 | 0.18 | -0.29 |
| Chief Executives | 0.70 | 0.10 | 0.74 | 0.08 | -0.44 |
| Child, Family, and School Social Workers | 0.46 | 0.14 | 0.43 | 0.13 | 0.22 |
| Childcare Workers | 0.40 | 0.16 | 0.40 | 0.14 | 0.00 |
| Civil Engineers | 0.15 | 0.15 | 0.32 | 0.22 | -0.90 |
| Claims Adjusters, Examiners, and Investigators | 0.37 | 0.15 | 0.37 | 0.13 | 0.00 |
| Clergy | 0.34 | 0.20 | 0.32 | 0.20 | 0.10 |
| Clinical and Counseling Psychologists | 0.61 | 0.17 | 0.60 | 0.16 | 0.06 |
| Coaches and Scouts | 0.54 | 0.12 | 0.52 | 0.11 | 0.17 |
| Compensation, Benefits, and Job Analysis Specialists | 0.44 | 0.20 | 0.40 | 0.18 | 0.21 |
| Computer Programmers | 0.20 | 0.17 | 0.27 | 0.19 | -0.39 |
| Computer Systems Analysts | 0.29 | 0.18 | 0.33 | 0.18 | -0.22 |
| Computer User Support Specialists | 0.25 | 0.16 | 0.29 | 0.16 | -0.25 |
| Computer and Information Research Scientists | 0.33 | 0.21 | 0.46 | 0.20 | -0.63 |
| Computer and Information Systems Managers | 0.36 | 0.20 | 0.46 | 0.20 | -0.50 |
| Concierges | 0.34 | 0.20 | 0.32 | 0.18 | 0.11 |
| Construction Laborers | 0.21 | 0.12 | 0.26 | 0.13 | -0.40 |
| Construction Managers | 0.27 | 0.17 | 0.37 | 0.20 | -0.54 |
| Cooks, Fast Food | 0.25 | 0.08 | 0.23 | 0.07 | 0.27 |
| Cooks, Institution and Cafeteria | 0.24 | 0.14 | 0.30 | 0.15 | -0.41 |
| Cooks, Restaurant | 0.26 | 0.13 | 0.24 | 0.12 | 0.16 |
| Cooks, Short Order | 0.28 | 0.13 | 0.22 | 0.10 | 0.52 |
| Correctional Officers and Jailers | 0.19 | 0.13 | 0.19 | 0.12 | 0.00 |
| Counter and Rental Clerks | 0.26 | 0.11 | 0.27 | 0.11 | -0.09 |
| Court Reporters and Simultaneous Captioners | 0.31 | 0.20 | 0.29 | 0.18 | 0.11 |
| Craft Artists | 0.44 | 0.20 | 0.47 | 0.18 | -0.16 |
| Credit Analysts | 0.30 | 0.17 | 0.31 | 0.16 | -0.06 |
| Customer Service Representatives | 0.30 | 0.12 | 0.27 | 0.11 | 0.26 |
| Dancers | 0.49 | 0.14 | 0.45 | 0.14 | 0.29 |
| Data Entry Keyers | 0.28 | 0.13 | 0.23 | 0.10 | 0.43 |
| Database Administrators | 0.36 | 0.21 | 0.41 | 0.20 | -0.24 |
| Demonstrators and Product Promoters | 0.34 | 0.17 | 0.32 | 0.16 | 0.12 |
| Dental Assistants | 0.29 | 0.16 | 0.27 | 0.13 | 0.14 |
| Detectives and Criminal Investigators | 0.41 | 0.23 | 0.42 | 0.20 | -0.05 |
| Dining Room and Cafeteria Attendants and Bartender Helpers | 0.29 | 0.12 | 0.33 | 0.12 | -0.33 |
| Directors, Religious Activities and Education | 0.29 | 0.24 | 0.28 | 0.25 | 0.04 |
| Dishwashers | 0.29 | 0.11 | 0.28 | 0.10 | 0.10 |
| Driver/Sales Workers | 0.20 | 0.09 | 0.25 | 0.10 | -0.53 |
| Editors | 0.24 | 0.13 | 0.21 | 0.11 | 0.25 |
| Education Administrators, Kindergarten through Secondary | 0.48 | 0.20 | 0.50 | 0.19 | -0.10 |
| Education Administrators, Postsecondary | 0.65 | 0.15 | 0.63 | 0.14 | 0.14 |
| Education Teachers, Postsecondary | 0.67 | 0.13 | 0.70 | 0.11 | -0.25 |
| Education and Childcare Administrators, Preschool and Daycare | 0.42 | 0.22 | 0.47 | 0.21 | -0.23 |
| Educational, Guidance, and Career Counselors and Advisors | 0.66 | 0.15 | 0.62 | 0.14 | 0.28 |
| Electrical Engineers | 0.28 | 0.15 | 0.40 | 0.17 | -0.75 |
| Electricians | 0.19 | 0.15 | 0.29 | 0.19 | -0.58 |
| Elementary School Teachers, Except Special Education | 0.30 | 0.23 | 0.28 | 0.21 | 0.09 |
| Emergency Medical Technicians | 0.31 | 0.18 | 0.26 | 0.14 | 0.31 |
| English Language and Literature Teachers, Postsecondary | 0.44 | 0.19 | 0.37 | 0.18 | 0.38 |
| Environmental Scientists and Specialists, Including Health | 0.39 | 0.19 | 0.50 | 0.19 | -0.58 |
| Executive Secretaries and Executive Administrative Assistants | 0.29 | 0.20 | 0.21 | 0.15 | 0.45 |
| Exercise Trainers and Group Fitness Instructors | 0.40 | 0.14 | 0.40 | 0.13 | 0.00 |
| Farmworkers and Laborers, Crop, Nursery, and Greenhouse | 0.31 | 0.17 | 0.33 | 0.17 | -0.12 |
| Farmworkers, Farm, Ranch, and Aquacultural Animals | 0.32 | 0.18 | 0.40 | 0.19 | -0.43 |
| Fashion Designers | 0.46 | 0.22 | 0.44 | 0.20 | 0.10 |
| Fast Food and Counter Workers | 0.28 | 0.07 | 0.29 | 0.07 | -0.14 |
| File Clerks | 0.26 | 0.15 | 0.20 | 0.12 | 0.44 |
| Film and Video Editors | 0.37 | 0.16 | 0.43 | 0.16 | -0.38 |
| Financial Examiners | 0.48 | 0.16 | 0.54 | 0.15 | -0.39 |
| Financial Managers | 0.43 | 0.17 | 0.51 | 0.16 | -0.48 |
| Financial Risk Specialists | 0.40 | 0.17 | 0.41 | 0.15 | -0.06 |
| Financial and Investment Analysts | 0.30 | 0.17 | 0.34 | 0.16 | -0.24 |
| Fine Artists, Including Painters, Sculptors, and Illustrators | 0.42 | 0.15 | 0.39 | 0.14 | 0.21 |
| First-Line Supervisors of Construction Trades and Extraction Workers | 0.23 | 0.17 | 0.33 | 0.20 | -0.54 |
| First-Line Supervisors of Food Preparation and Serving Workers | 0.29 | 0.11 | 0.30 | 0.11 | -0.09 |
| First-Line Supervisors of Material-Moving Machine and Vehicle Operators | 0.36 | 0.18 | 0.36 | 0.17 | 0.00 |
| First-Line Supervisors of Mechanics, Installers, and Repairers | 0.45 | 0.20 | 0.50 | 0.20 | -0.25 |
| First-Line Supervisors of Non-Retail Sales Workers | 0.36 | 0.19 | 0.39 | 0.19 | -0.16 |
| First-Line Supervisors of Office and Administrative Support Workers | 0.43 | 0.17 | 0.41 | 0.15 | 0.12 |
| First-Line Supervisors of Personal Service Workers | 0.45 | 0.18 | 0.45 | 0.17 | 0.00 |
| First-Line Supervisors of Production and Operating Workers | 0.40 | 0.17 | 0.45 | 0.17 | -0.29 |
| First-Line Supervisors of Retail Sales Workers | 0.24 | 0.13 | 0.26 | 0.13 | -0.15 |
| Food Preparation Workers | 0.31 | 0.09 | 0.31 | 0.09 | 0.00 |
| Food Servers, Nonrestaurant | 0.32 | 0.10 | 0.31 | 0.09 | 0.11 |
| Food Service Managers | 0.24 | 0.10 | 0.25 | 0.11 | -0.10 |
| Fraud Examiners, Investigators and Analysts | 0.43 | 0.16 | 0.42 | 0.15 | 0.06 |
| Fundraisers | 0.36 | 0.22 | 0.31 | 0.20 | 0.24 |
| Gambling Change Persons and Booth Cashiers | 0.39 | 0.20 | 0.43 | 0.20 | -0.20 |
| General and Operations Managers | 0.47 | 0.14 | 0.52 | 0.13 | -0.37 |
| Graphic Designers | 0.31 | 0.13 | 0.33 | 0.12 | -0.16 |
| Hairdressers, Hairstylists, and Cosmetologists | 0.35 | 0.12 | 0.36 | 0.12 | -0.08 |
| Health Education Specialists | 0.49 | 0.21 | 0.43 | 0.20 | 0.29 |
| Heavy and Tractor-Trailer Truck Drivers | 0.20 | 0.13 | 0.27 | 0.15 | -0.50 |
| Helpers–Installation, Maintenance, and Repair Workers | 0.27 | 0.12 | 0.29 | 0.11 | -0.17 |
| Home Health Aides | 0.35 | 0.12 | 0.35 | 0.11 | 0.00 |
| Hosts and Hostesses, Restaurant, Lounge, and Coffee Shop | 0.34 | 0.10 | 0.35 | 0.09 | -0.11 |
| Hotel, Motel, and Resort Desk Clerks | 0.26 | 0.17 | 0.27 | 0.15 | -0.06 |
| Human Resources Assistants, Except Payroll and Timekeeping | 0.42 | 0.18 | 0.37 | 0.16 | 0.29 |
| Human Resources Managers | 0.44 | 0.22 | 0.46 | 0.21 | -0.09 |
| Human Resources Specialists | 0.44 | 0.16 | 0.44 | 0.16 | 0.00 |
| Infantry | 0.19 | 0.14 | 0.24 | 0.16 | -0.33 |
| Information Technology Project Managers | 0.32 | 0.20 | 0.39 | 0.20 | -0.35 |
| Inspectors, Testers, Sorters, Samplers, and Weighers | 0.21 | 0.17 | 0.22 | 0.16 | -0.06 |
| Instructional Coordinators | 0.56 | 0.13 | 0.53 | 0.12 | 0.24 |
| Insurance Claims and Policy Processing Clerks | 0.30 | 0.15 | 0.25 | 0.12 | 0.37 |
| Insurance Sales Agents | 0.23 | 0.17 | 0.30 | 0.19 | -0.39 |
| Insurance Underwriters | 0.39 | 0.18 | 0.41 | 0.16 | -0.12 |
| Interior Designers | 0.33 | 0.20 | 0.34 | 0.19 | -0.05 |
| Janitors and Cleaners, Except Maids and Housekeeping Cleaners | 0.23 | 0.08 | 0.25 | 0.07 | -0.27 |
| Judges, Magistrate Judges, and Magistrates | 0.26 | 0.16 | 0.23 | 0.13 | 0.21 |
| Kindergarten Teachers, Except Special Education | 0.28 | 0.22 | 0.30 | 0.21 | -0.09 |
| Laborers and Freight, Stock, and Material Movers, Hand | 0.25 | 0.09 | 0.24 | 0.08 | 0.12 |
| Landscaping and Groundskeeping Workers | 0.26 | 0.12 | 0.31 | 0.13 | -0.40 |
| Lawyers | 0.15 | 0.15 | 0.16 | 0.15 | -0.07 |
| Librarians and Media Collections Specialists | 0.53 | 0.11 | 0.55 | 0.10 | -0.19 |
| Library Technicians | 0.47 | 0.17 | 0.36 | 0.14 | 0.71 |
| Licensed Practical and Licensed Vocational Nurses | 0.32 | 0.20 | 0.29 | 0.18 | 0.16 |
| Lifeguards, Ski Patrol, and Other Recreational Protective Service Workers | 0.46 | 0.12 | 0.47 | 0.12 | -0.08 |
| Light Truck Drivers | 0.24 | 0.08 | 0.25 | 0.08 | -0.13 |
| Loan Officers | 0.25 | 0.11 | 0.23 | 0.10 | 0.19 |
| Logisticians | 0.43 | 0.19 | 0.40 | 0.16 | 0.17 |
| Machinists | 0.11 | 0.09 | 0.20 | 0.13 | -0.80 |
| Maids and Housekeeping Cleaners | 0.24 | 0.09 | 0.26 | 0.09 | -0.22 |
| Maintenance and Repair Workers, General | 0.23 | 0.14 | 0.34 | 0.18 | -0.68 |
| Management Analysts | 0.41 | 0.16 | 0.44 | 0.15 | -0.19 |
| Market Research Analysts and Marketing Specialists | 0.36 | 0.17 | 0.39 | 0.17 | -0.18 |
| Marketing Managers | 0.31 | 0.18 | 0.38 | 0.18 | -0.39 |
| Massage Therapists | 0.43 | 0.21 | 0.45 | 0.20 | -0.10 |
| Mechanical Engineers | 0.24 | 0.14 | 0.41 | 0.17 | -1.09 |
| Media Programming Directors | 0.60 | 0.17 | 0.62 | 0.16 | -0.12 |
| Medical Assistants | 0.33 | 0.14 | 0.31 | 0.12 | 0.15 |
| Medical Scientists, Except Epidemiologists | 0.30 | 0.19 | 0.34 | 0.18 | -0.22 |
| Medical Secretaries and Administrative Assistants | 0.19 | 0.17 | 0.13 | 0.11 | 0.42 |
| Medical Transcriptionists | 0.33 | 0.21 | 0.30 | 0.18 | 0.15 |
| Medical and Clinical Laboratory Technicians | 0.29 | 0.19 | 0.29 | 0.18 | 0.00 |
| Medical and Clinical Laboratory Technologists | 0.27 | 0.20 | 0.26 | 0.18 | 0.05 |
| Medical and Health Services Managers | 0.61 | 0.16 | 0.58 | 0.16 | 0.19 |
| Meeting, Convention, and Event Planners | 0.47 | 0.22 | 0.48 | 0.19 | -0.05 |
| Mental Health Counselors | 0.44 | 0.21 | 0.41 | 0.18 | 0.15 |
| Mental Health and Substance Abuse Social Workers | 0.32 | 0.21 | 0.27 | 0.18 | 0.26 |
| Middle School Teachers, Except Special and Career/Technical Education | 0.35 | 0.24 | 0.32 | 0.21 | 0.13 |
| Models | 0.45 | 0.19 | 0.39 | 0.17 | 0.33 |
| Musicians and Singers | 0.32 | 0.15 | 0.33 | 0.14 | -0.07 |
| Nannies | 0.39 | 0.14 | 0.37 | 0.12 | 0.15 |
| Network and Computer Systems Administrators | 0.20 | 0.18 | 0.29 | 0.21 | -0.46 |
| News Analysts, Reporters, and Journalists | 0.19 | 0.16 | 0.19 | 0.15 | 0.00 |
| Nursing Assistants | 0.34 | 0.15 | 0.32 | 0.13 | 0.14 |
| Office Clerks, General | 0.32 | 0.15 | 0.27 | 0.12 | 0.37 |
| Orderlies | 0.25 | 0.14 | 0.24 | 0.12 | 0.08 |
| Packaging and Filling Machine Operators and Tenders | 0.23 | 0.12 | 0.23 | 0.11 | 0.00 |
| Packers and Packagers, Hand | 0.24 | 0.13 | 0.26 | 0.13 | -0.15 |
| Painters, Construction and Maintenance | 0.14 | 0.11 | 0.24 | 0.17 | -0.70 |
| Parts Salespersons | 0.26 | 0.14 | 0.27 | 0.14 | -0.07 |
| Payroll and Timekeeping Clerks | 0.37 | 0.25 | 0.32 | 0.22 | 0.21 |
| Personal Care Aides | 0.39 | 0.11 | 0.41 | 0.10 | -0.19 |
| Personal Financial Advisors | 0.34 | 0.19 | 0.41 | 0.21 | -0.35 |
| Pharmacists | 0.46 | 0.23 | 0.42 | 0.21 | 0.18 |
| Pharmacy Aides | 0.34 | 0.11 | 0.34 | 0.10 | 0.00 |
| Pharmacy Technicians | 0.33 | 0.14 | 0.30 | 0.12 | 0.23 |
| Photographers | 0.39 | 0.14 | 0.39 | 0.14 | 0.00 |
| Physical Therapist Aides | 0.38 | 0.19 | 0.33 | 0.17 | 0.28 |
| Physical Therapists | 0.35 | 0.19 | 0.33 | 0.17 | 0.11 |
| Police and Sheriff’s Patrol Officers | 0.19 | 0.16 | 0.25 | 0.18 | -0.35 |
| Preschool Teachers, Except Special Education | 0.31 | 0.18 | 0.30 | 0.17 | 0.06 |
| Probation Officers and Correctional Treatment Specialists | 0.33 | 0.18 | 0.32 | 0.18 | 0.06 |
| Property, Real Estate, and Community Association Managers | 0.32 | 0.17 | 0.35 | 0.16 | -0.18 |
| Psychiatric Aides | 0.32 | 0.16 | 0.26 | 0.13 | 0.41 |
| Psychology Teachers, Postsecondary | 0.74 | 0.12 | 0.76 | 0.10 | -0.18 |
| Public Relations Managers | 0.39 | 0.21 | 0.48 | 0.21 | -0.43 |
| Public Relations Specialists | 0.32 | 0.18 | 0.35 | 0.17 | -0.17 |
| Purchasing Agents, Except Wholesale, Retail, and Farm Products | 0.45 | 0.19 | 0.47 | 0.17 | -0.11 |
| Purchasing Managers | 0.49 | 0.24 | 0.55 | 0.22 | -0.26 |
| Radiologic Technologists and Technicians | 0.42 | 0.21 | 0.47 | 0.20 | -0.24 |
| Real Estate Brokers | 0.23 | 0.17 | 0.22 | 0.15 | 0.06 |
| Real Estate Sales Agents | 0.19 | 0.12 | 0.20 | 0.12 | -0.08 |
| Receptionists and Information Clerks | 0.33 | 0.18 | 0.27 | 0.14 | 0.37 |
| Recreation Workers | 0.50 | 0.13 | 0.50 | 0.12 | 0.00 |
| Registered Nurses | 0.35 | 0.21 | 0.33 | 0.18 | 0.10 |
| Rehabilitation Counselors | 0.52 | 0.24 | 0.56 | 0.23 | -0.17 |
| Residential Advisors | 0.55 | 0.17 | 0.55 | 0.16 | 0.00 |
| Retail Salespersons | 0.25 | 0.12 | 0.27 | 0.12 | -0.17 |
| Sales Engineers | 0.36 | 0.22 | 0.34 | 0.21 | 0.09 |
| Sales Managers | 0.32 | 0.17 | 0.41 | 0.18 | -0.51 |
| Sales Representatives of Services, Except Advertising, Insurance, Financial Services, and Travel | 0.28 | 0.13 | 0.29 | 0.13 | -0.08 |
| Sales Representatives, Wholesale and Manufacturing, Except Technical and Scientific Products | 0.24 | 0.14 | 0.26 | 0.15 | -0.14 |
| Sales Representatives, Wholesale and Manufacturing, Technical and Scientific Products | 0.23 | 0.13 | 0.27 | 0.14 | -0.30 |
| Secondary School Teachers, Except Special and Career/Technical Education | 0.38 | 0.23 | 0.36 | 0.21 | 0.09 |
| Secretaries and Administrative Assistants, Except Legal, Medical, and Executive | 0.29 | 0.18 | 0.22 | 0.14 | 0.43 |
| Securities, Commodities, and Financial Services Sales Agents | 0.33 | 0.16 | 0.36 | 0.17 | -0.18 |
| Security Guards | 0.20 | 0.10 | 0.22 | 0.11 | -0.19 |
| Self-Enrichment Teachers | 0.52 | 0.19 | 0.49 | 0.17 | 0.17 |
| Shipping, Receiving, and Inventory Clerks | 0.21 | 0.15 | 0.21 | 0.14 | 0.00 |
| Skincare Specialists | 0.40 | 0.18 | 0.42 | 0.17 | -0.11 |
| Social Science Research Assistants | 0.41 | 0.21 | 0.31 | 0.18 | 0.51 |
| Social and Community Service Managers | 0.49 | 0.16 | 0.47 | 0.15 | 0.13 |
| Social and Human Service Assistants | 0.43 | 0.13 | 0.43 | 0.12 | 0.00 |
| Software Developers | 0.19 | 0.18 | 0.26 | 0.20 | -0.37 |
| Special Education Teachers, Elementary School | 0.25 | 0.25 | 0.17 | 0.19 | 0.36 |
| Substance Abuse and Behavioral Disorder Counselors | 0.47 | 0.20 | 0.46 | 0.18 | 0.05 |
| Switchboard Operators, Including Answering Service | 0.32 | 0.16 | 0.30 | 0.14 | 0.13 |
| Tank Car, Truck, and Ship Loaders | 0.36 | 0.21 | 0.32 | 0.19 | 0.20 |
| Tax Preparers | 0.15 | 0.16 | 0.18 | 0.17 | -0.18 |
| Taxi Drivers | 0.16 | 0.15 | 0.20 | 0.16 | -0.26 |
| Teaching Assistants, Postsecondary | 0.62 | 0.12 | 0.59 | 0.11 | 0.26 |
| Teaching Assistants, Preschool, Elementary, Middle, and Secondary School, Except Special Education | 0.41 | 0.16 | 0.40 | 0.14 | 0.07 |
| Team Assemblers | 0.22 | 0.09 | 0.24 | 0.10 | -0.21 |
| Telecommunications Equipment Installers and Repairers, Except Line Installers | 0.20 | 0.16 | 0.26 | 0.18 | -0.35 |
| Telemarketers | 0.19 | 0.10 | 0.18 | 0.10 | 0.10 |
| Telephone Operators | 0.33 | 0.13 | 0.32 | 0.11 | 0.08 |
| Tellers | 0.31 | 0.15 | 0.29 | 0.15 | 0.13 |
| Tire Builders | 0.22 | 0.08 | 0.23 | 0.08 | -0.13 |
| Training and Development Managers | 0.58 | 0.18 | 0.59 | 0.17 | -0.06 |
| Training and Development Specialists | 0.52 | 0.14 | 0.49 | 0.13 | 0.22 |
| Transportation, Storage, and Distribution Managers | 0.46 | 0.18 | 0.47 | 0.17 | -0.06 |
| Tutors | 0.56 | 0.13 | 0.55 | 0.12 | 0.08 |
| Umpires, Referees, and Other Sports Officials | 0.53 | 0.18 | 0.56 | 0.17 | -0.17 |
| Veterinary Assistants and Laboratory Animal Caretakers | 0.39 | 0.16 | 0.40 | 0.15 | -0.06 |
| Veterinary Technologists and Technicians | 0.37 | 0.18 | 0.35 | 0.17 | 0.11 |
| Waiters and Waitresses | 0.28 | 0.09 | 0.27 | 0.08 | 0.12 |
| Wholesale and Retail Buyers, Except Farm Products | 0.36 | 0.13 | 0.39 | 0.12 | -0.24 |