Chapter 3 The General Occupational Themes
The technical manual for the previous version of the Strong assessment (Donnay et al. (2005)) covers essential background information on the General Occupational Themes (GOTs), including information on the theory behind the GOTs and their history, content, and interpretation. Readers are encouraged to make use of this valuable conceptual information, which carries over to the GOTs in the Strong 244 assessment.
Here, we include basic psychometric information for the GOTs on the Strong 244 assessment. There were several changes to the GOTs, but the themes themselves were intended to be consistent with the prior version.
3.1 IRT scoring
A new feature of the Strong 244 assessment is the introduction of scoring based on item response theory (IRT). IRT scoring is used for all GOTs, Basic Interest Scales, and two of the six Personal Style Scales (Risk Taking and Team Orientation). The IRT model used for each of these scales is the graded response model (Samejima (1997)).
3.1.1 Test information curves
The overall aim with the Strong 244 assessment was to produce scales that have the maximum information in the middle of the scale range, as this is where most respondents are likely to score. It was also desirable to have more information at higher scores than at lower scores, as respondents are likely to pay more attention to, and take action on, the scales they score higher on. The six test information curves included in this chapter show that maximum information occurs near the midpoint for each of the GOTs, and generally there is more information at higher levels of theta than at lower levels of theta.
To view the test information curve for the Realistic scale, see Figure 3.1, for Investigative , see Figure 3.2, for Artistic , see Figure 3.3, for Social, see Figure 3.4, for Enterprising, see Figure 3.5, and for Conventional, see Figure 3.6.
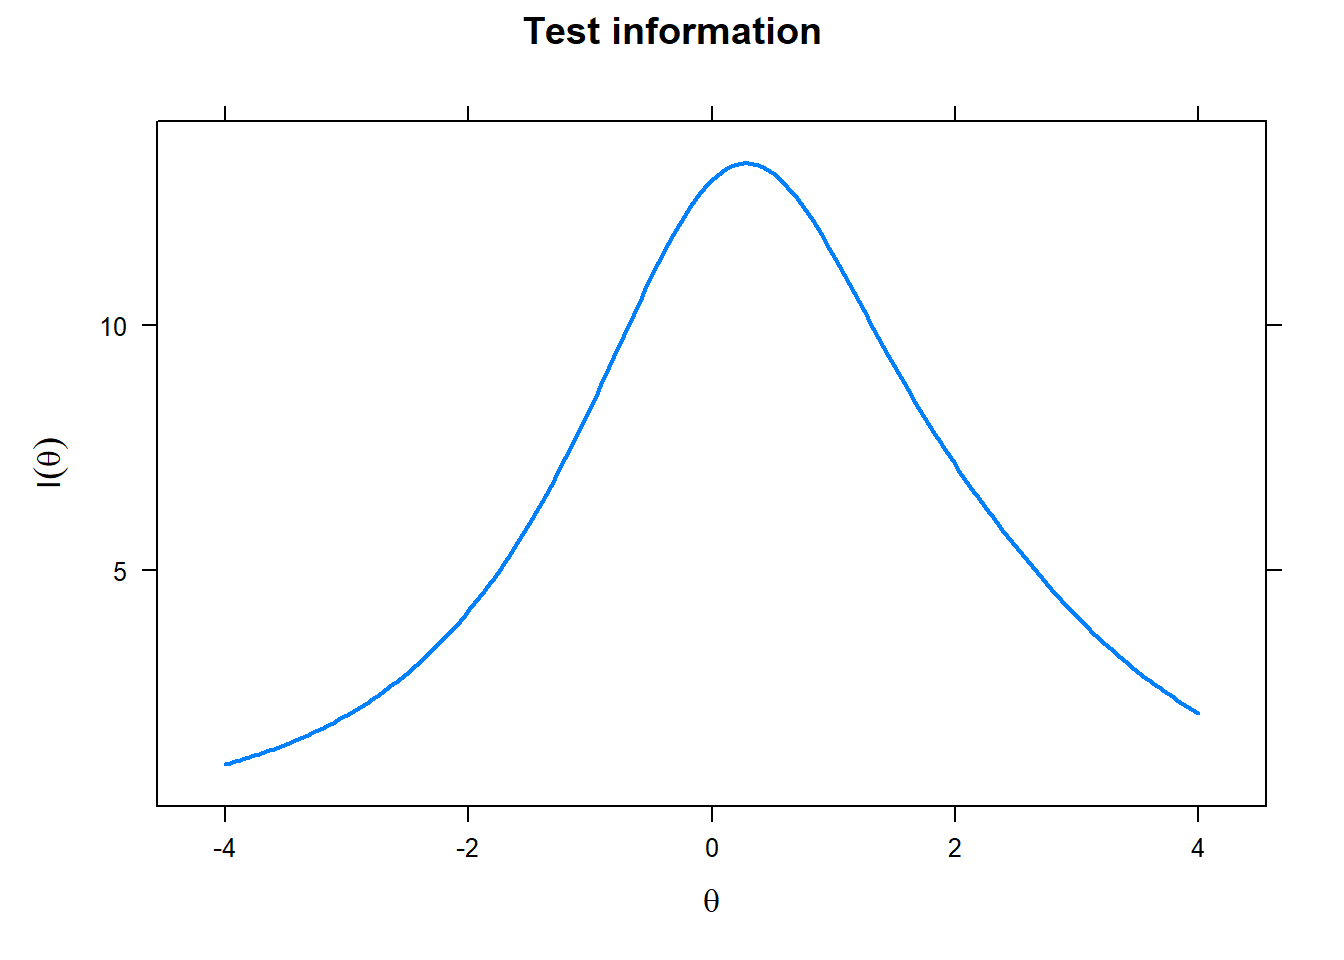
Figure 3.1: Test information curve: Realistic
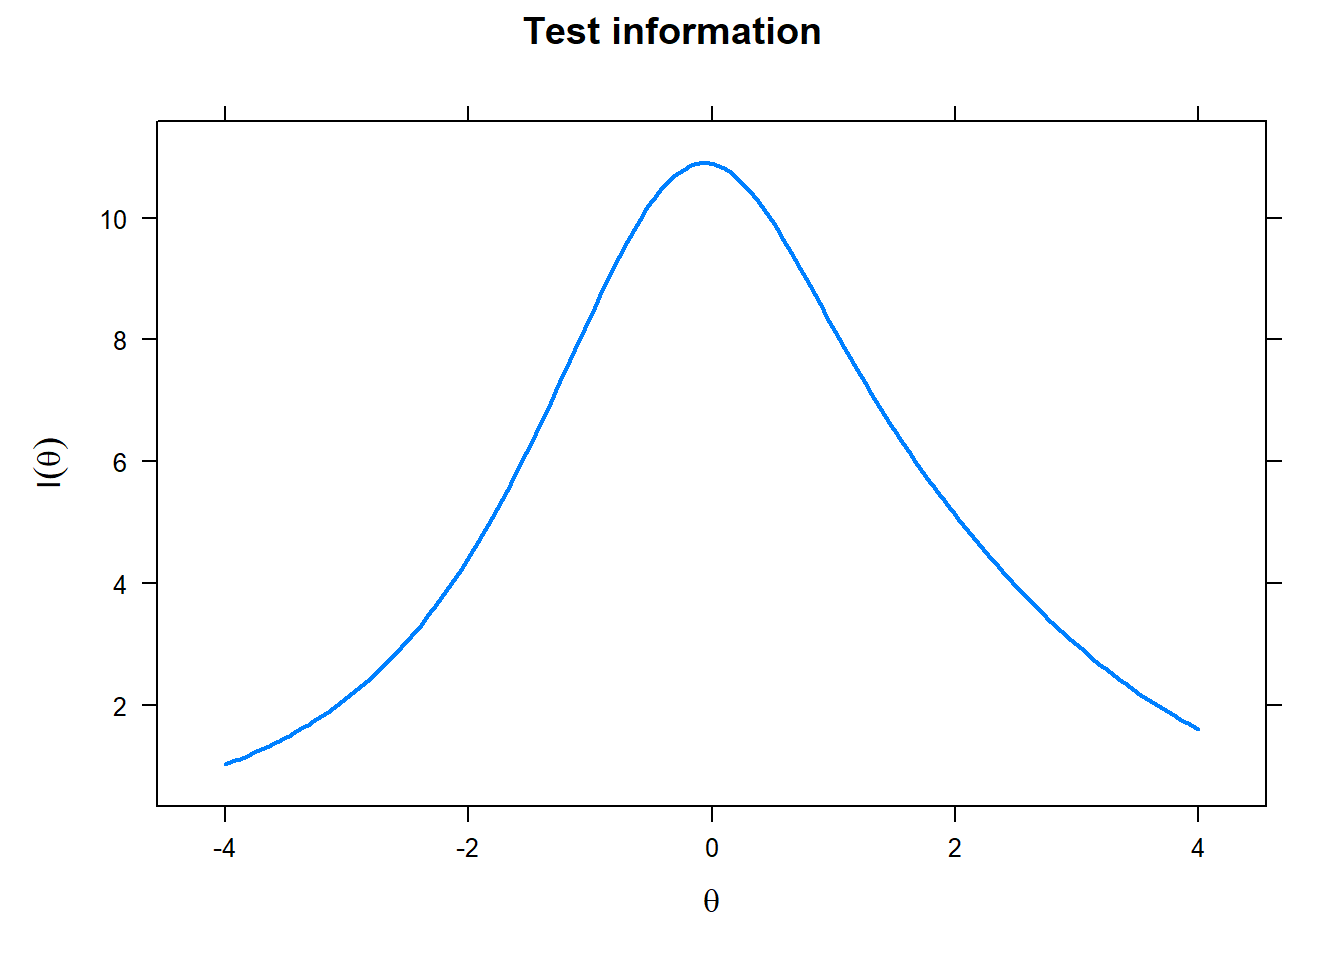
Figure 3.2: Test information curve: Investigative
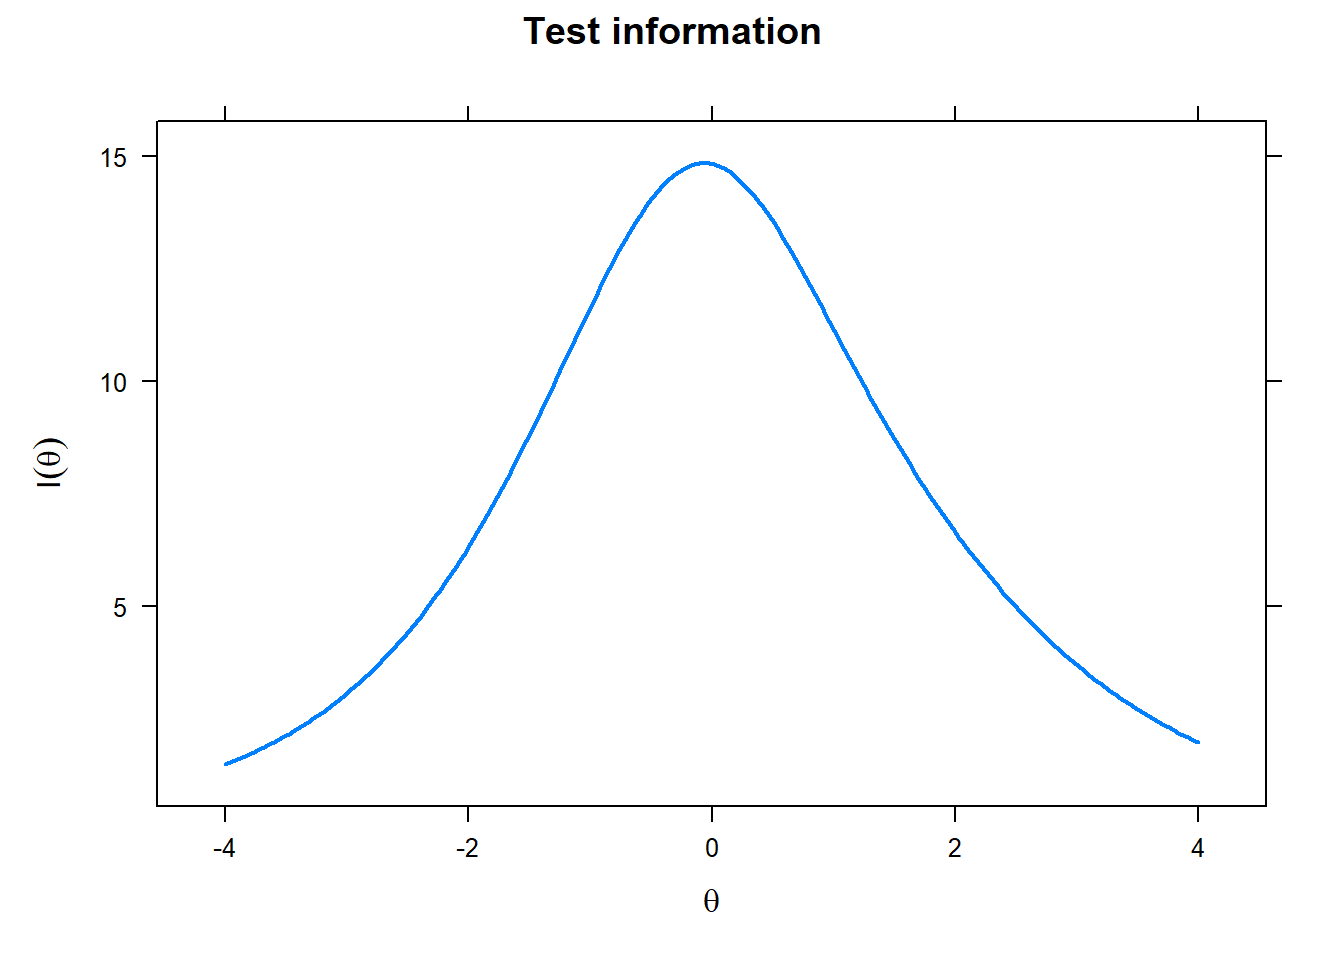
Figure 3.3: Test information curve: Artistic
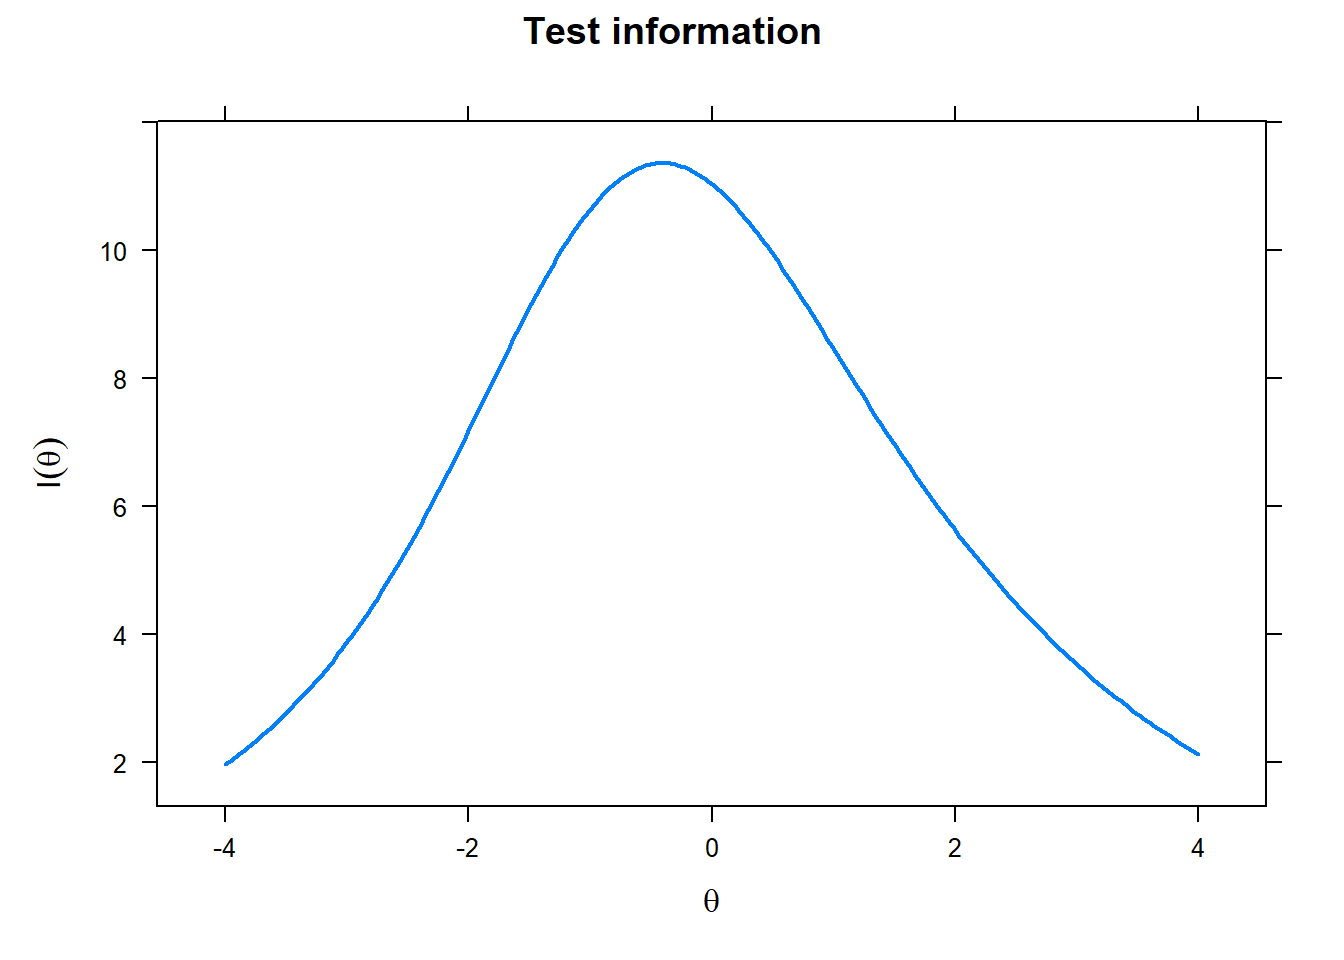
Figure 3.4: Test information curve: Social
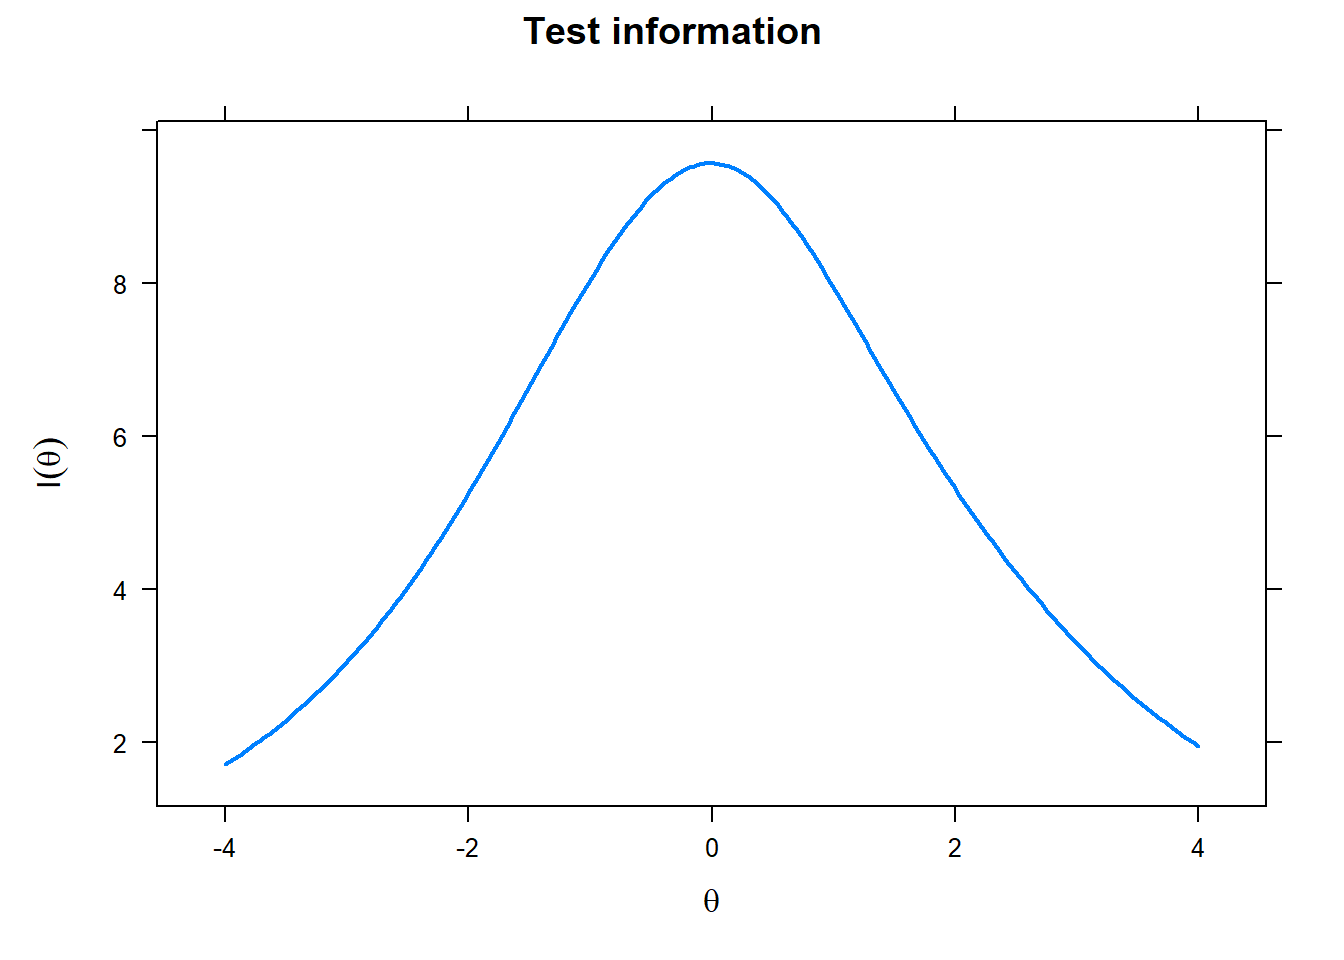
Figure 3.5: Test information curve: Enterprising
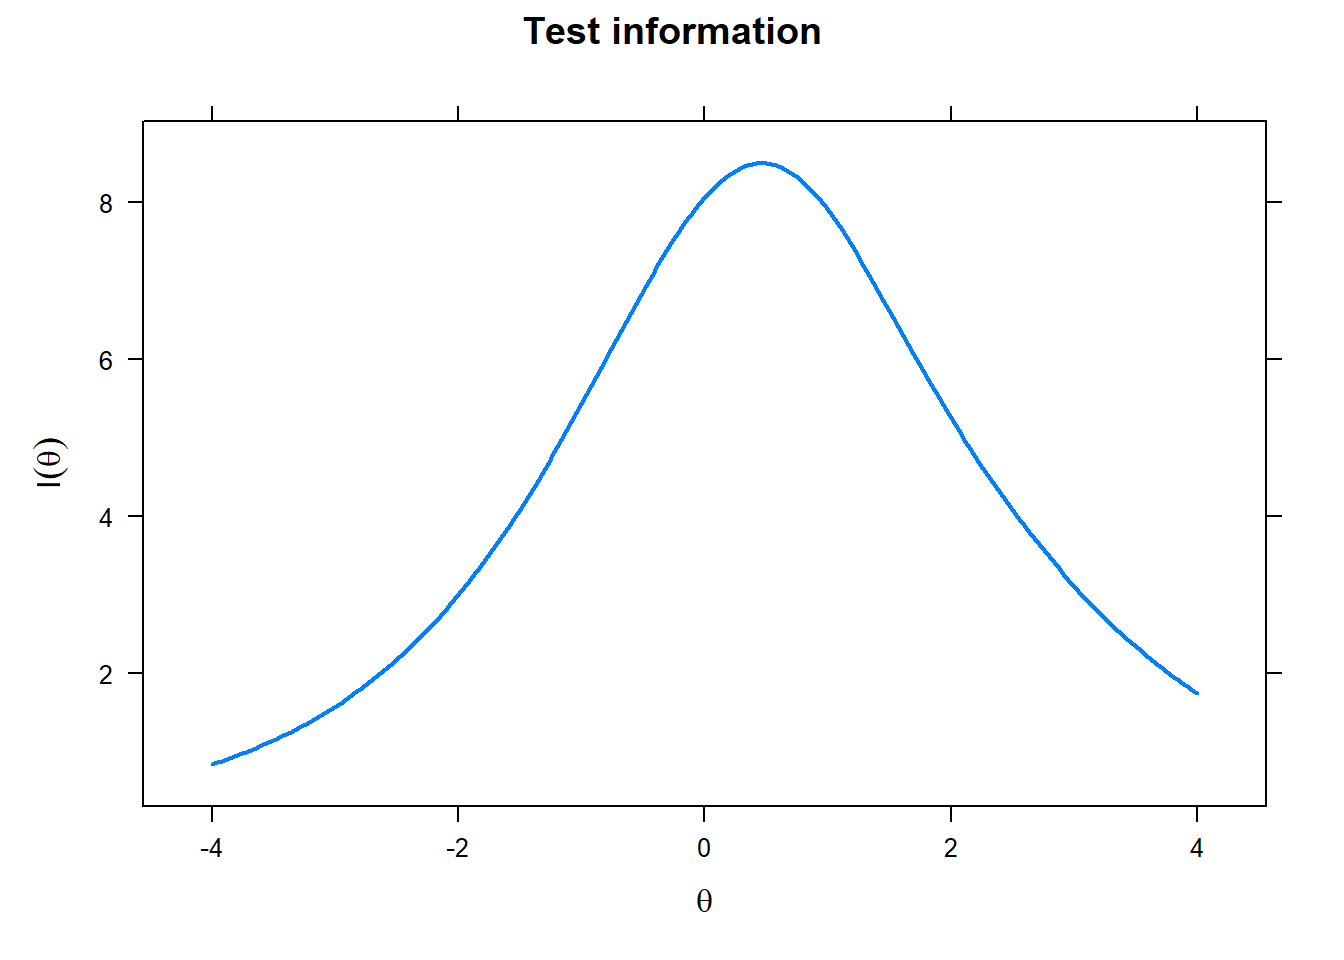
Figure 3.6: Test information curve: Conventional
3.2 Standard score interpretive labels
The Strong 244 assessment applies interpretive labels to each GOT and Basic Interest Scale score for ease of interpretation. In previous versions of the Strong assessment, these labels were applied on the basis of same gender norms. For the Strong 244 assessment, all labels are applied on a combined gender basis. As a result, the same score ranges (see Table 3.1) can be applied to all GOT and Basic Interest Scale scores.
| Interest level | Score range (inclusive) |
|---|---|
| Very Little | <=34 |
| Little | 35-44 |
| Moderate | 45-55 |
| High | 56-65 |
| Very High | >=66 |
3.3 Reliability
For internal consistency results, see Table 3.2.
| GOT | Number of items | r with 2004 | Alpha | Retest short | Retest long |
|---|---|---|---|---|---|
| Realistic | 20 | 0.96 | 0.89 | 0.87 | 0.88 |
| Investigative | 16 | 0.96 | 0.88 | 0.84 | 0.88 |
| Artistic | 23 | 0.98 | 0.91 | 0.79 | 0.73 |
| Social | 24 | 0.98 | 0.89 | 0.84 | 0.78 |
| Enterprising | 21 | 0.98 | 0.87 | 0.84 | 0.85 |
| Conventional | 16 | 0.95 | 0.84 | 0.85 | 0.77 |
3.4 Validity
3.4.1 Correlations among the GOTs
For correlations among the six GOTs, see Table 3.3.
| Realistic | Investigative | Artistic | Social | Enterprising | Conventional | |
|---|---|---|---|---|---|---|
| Realistic | ||||||
| Investigative | 0.63 | |||||
| Artistic | 0.38 | 0.47 | ||||
| Social | 0.23 | 0.34 | 0.53 | |||
| Enterprising | 0.43 | 0.33 | 0.44 | 0.53 | ||
| Conventional | 0.51 | 0.47 | 0.20 | 0.32 | 0.52 |
3.4.2 Randomization test of hypothesized order relations
The randomization test of hypothesized order relations (RTHOR; Hubert & Arabie (1987)) is commonly used with assessments based on the RIASEC model. The RTHORR package (T. J. G. Tracey & Morris (2021)) computes a consistency index and associated p-value to determine if the pattern of correlations observed matches what we would expect.
For RTHOR results, see Table 3.4.
| Predictions | Met | Tied | CI | p |
|---|---|---|---|---|
| 72 | 71 | 0 | 0.97 | 0.02 |
3.4.3 Correlations between GOTs and preference scales on the MBTI® Step I™ assessment
Correlations between the GOTs and MBTI® Global Step I™ assessment continuous (logit) preference scales are reported in Table 3.5.
| Extraversion–Introversion | Sensing–Intuition | Thinking–Feeling | Judging–Perceiving | |
|---|---|---|---|---|
| Realistic | 0.08 | -0.02 | -0.26 | 0.11 |
| Investigative | 0.08 | 0.07 | -0.20 | 0.05 |
| Artistic | 0.02 | 0.36 | 0.05 | 0.14 |
| Social | -0.19 | 0.03 | 0.20 | -0.11 |
| Enterprising | -0.18 | 0.04 | -0.13 | 0.03 |
| Conventional | 0.03 | -0.22 | -0.18 | -0.12 |
3.4.4 Correlations between GOTs and CPI 260® assessment scales
Correlations between the GOTs and CPI 260® assessment scales are reported in Table 3.6.
| Realistic | Investigative | Artistic | Social | Enterprising | Conventional | |
|---|---|---|---|---|---|---|
| Dominance | 0.18 | 0.11 | 0.05 | 0.18 | 0.42 | 0.16 |
| Capacity for Status | 0.05 | 0.15 | 0.34 | 0.21 | 0.32 | 0.02 |
| Sociability | 0.10 | 0.10 | 0.17 | 0.22 | 0.39 | 0.10 |
| Social Presence | 0.00 | 0.03 | 0.22 | 0.11 | 0.28 | -0.03 |
| Self-acceptance | 0.10 | 0.07 | 0.11 | 0.14 | 0.40 | 0.08 |
| Independence | 0.21 | 0.13 | 0.04 | 0.06 | 0.33 | 0.14 |
| Empathy | 0.02 | 0.10 | 0.34 | 0.25 | 0.23 | -0.03 |
| Responsibility | 0.09 | 0.22 | 0.10 | 0.18 | 0.04 | 0.12 |
| Social Conformity | 0.11 | 0.09 | -0.08 | 0.11 | 0.11 | 0.18 |
| Self-control | 0.17 | 0.16 | -0.10 | 0.07 | -0.08 | 0.19 |
| Good Impression | 0.24 | 0.20 | -0.04 | 0.17 | 0.13 | 0.29 |
| Communality | 0.06 | 0.06 | -0.04 | 0.06 | -0.01 | 0.06 |
| Well-being | 0.21 | 0.15 | -0.04 | 0.10 | 0.19 | 0.18 |
| Tolerance | 0.06 | 0.11 | 0.12 | 0.13 | 0.02 | 0.02 |
| Achievement via Conformance | 0.16 | 0.21 | 0.04 | 0.24 | 0.18 | 0.25 |
| Achievement via Independence | 0.02 | 0.20 | 0.26 | 0.17 | 0.01 | -0.02 |
| Conceptual Fluency | 0.17 | 0.29 | 0.19 | 0.15 | 0.14 | 0.11 |
| Insightfulness | 0.15 | 0.26 | 0.12 | 0.13 | 0.07 | 0.12 |
| Flexibility | -0.18 | -0.05 | 0.23 | 0.02 | -0.14 | -0.26 |
| Sensitivity | -0.48 | -0.18 | 0.22 | 0.11 | -0.30 | -0.27 |
| Vector 1 | -0.03 | 0.00 | -0.12 | -0.14 | -0.40 | -0.05 |
| Vector 2 | 0.16 | 0.14 | -0.10 | 0.14 | 0.16 | 0.27 |
| Vector 3 | 0.05 | 0.11 | 0.12 | 0.13 | 0.04 | 0.02 |
| Managerial Potential | 0.16 | 0.14 | 0.05 | 0.15 | 0.23 | 0.15 |
| Work Orientation | 0.22 | 0.23 | 0.02 | 0.13 | 0.09 | 0.19 |
| Creative Temperament | -0.10 | 0.02 | 0.29 | 0.09 | 0.07 | -0.18 |
| Leadership | 0.21 | 0.17 | 0.07 | 0.21 | 0.36 | 0.20 |
| Amicability | 0.15 | 0.13 | -0.02 | 0.14 | 0.07 | 0.17 |
| Law Enforcement Orientation | 0.33 | 0.13 | -0.24 | 0.06 | 0.24 | 0.31 |
3.4.5 Correlations between GOTs and FIRO-B® assessment scales
Correlations between the GOTs and the interpersonal need scales measured by the FIRO-B® assessment are reported in Table 3.7.
| Expressed Inclusion | Expressed Control | Expressed Affection | Wanted Inclusion | Wanted Control | Wanted Affection | |
|---|---|---|---|---|---|---|
| Realistic | -0.01 | 0.07 | -0.09 | -0.04 | -0.01 | -0.11 |
| Investigative | 0.00 | 0.03 | -0.04 | -0.01 | -0.01 | -0.04 |
| Artistic | 0.06 | -0.01 | 0.08 | 0.05 | 0.03 | 0.08 |
| Social | 0.20 | 0.02 | 0.22 | 0.07 | 0.05 | 0.13 |
| Enterprising | 0.26 | 0.27 | 0.15 | 0.15 | -0.03 | 0.08 |
| Conventional | 0.02 | 0.05 | -0.08 | -0.05 | 0.01 | -0.11 |
3.4.6 Correlations between GOTs and TKI® assessment scales
Correlations between the GOTs and conflict-handling mode scales on the TKI® assessment are reported in Table 3.8.
| Accommodating | Avoiding | Collaborating | Competing | Compromising | |
|---|---|---|---|---|---|
| Realistic | -0.11 | -0.05 | 0.06 | 0.07 | 0.02 |
| Investigative | -0.06 | -0.05 | 0.05 | 0.05 | 0.01 |
| Artistic | 0.06 | -0.03 | 0.04 | -0.08 | 0.03 |
| Social | 0.10 | -0.05 | 0.08 | -0.13 | 0.04 |
| Enterprising | -0.13 | -0.21 | 0.13 | 0.12 | 0.08 |
| Conventional | -0.12 | -0.04 | 0.03 | 0.06 | 0.05 |
3.4.7 Group differences
3.4.7.1 Gender
Gender differences on vocational interests have been found consistently for decades, and exist across various interest inventories, including the Strong assessment (M. L. Morris (2016); Su et al. (2009)).
For difference by gender for the six GOTs, see Table 3.9.
| GOT | Female mean | Female SD | Male mean | Male SD | d |
|---|---|---|---|---|---|
| Realistic | 45.75 | 9.45 | 54.25 | 8.65 | -0.94 |
| Investigative | 48.47 | 10.26 | 51.54 | 9.50 | -0.31 |
| Artistic | 50.33 | 10.39 | 49.68 | 9.59 | 0.07 |
| Social | 51.20 | 10.17 | 48.82 | 9.69 | 0.24 |
| Enterprising | 48.78 | 10.00 | 51.23 | 9.86 | -0.25 |
| Conventional | 48.76 | 10.39 | 51.25 | 9.40 | -0.25 |
3.4.7.2 Ethnicity
For differences by ethnicity for the six GOTs, see Table 3.10.
| Ethnicity | n | Realistic mean | Realistic SD | Investigative mean | Investigative SD | Artistic mean | Artistic SD | Social mean | Social SD | Enterprising mean | Enterprising SD | Conventional mean | Conventional SD |
|---|---|---|---|---|---|---|---|---|---|---|---|---|---|
| Asian | 4,297 | 50.5 | 9.9 | 51.7 | 9.9 | 51.2 | 9.8 | 50.6 | 9.9 | 51.7 | 9.8 | 52.5 | 10.0 |
| Black | 7,139 | 48.8 | 10.6 | 49.0 | 10.5 | 49.9 | 10.3 | 51.8 | 10.8 | 50.9 | 10.6 | 51.7 | 10.9 |
| Hispanic | 11,257 | 49.3 | 10.4 | 49.9 | 10.5 | 49.4 | 10.2 | 50.2 | 10.6 | 49.6 | 10.6 | 51.2 | 10.4 |
| Indian | 969 | 52.6 | 9.4 | 54.3 | 9.4 | 52.2 | 8.9 | 52.0 | 9.1 | 52.9 | 9.3 | 54.1 | 9.3 |
| Middle Eastern | 970 | 49.8 | 9.7 | 50.9 | 9.9 | 50.0 | 10.0 | 49.7 | 9.8 | 51.3 | 9.7 | 50.6 | 9.9 |
| Native American | 6,784 | 48.9 | 10.5 | 49.3 | 10.5 | 50.2 | 10.2 | 52.1 | 10.7 | 51.3 | 10.6 | 52.1 | 10.7 |
| Pacific Islander | 543 | 50.3 | 10.2 | 50.1 | 10.4 | 50.4 | 9.9 | 51.2 | 9.6 | 50.7 | 9.9 | 51.1 | 10.2 |
| White | 69,891 | 50.3 | 9.8 | 50.1 | 9.8 | 50.1 | 10.0 | 49.6 | 9.7 | 49.7 | 9.8 | 49.2 | 9.6 |
3.4.7.3 Occupation category
For difference by occupation category for the six GOTs, see Table 3.11.
| Occupation category | n | Realistic mean | Realistic SD | Investigative mean | Investigative SD | Artistic mean | Artistic SD | Social mean | Social SD | Enterprising mean | Enterprising SD | Conventional mean | Conventional SD |
|---|---|---|---|---|---|---|---|---|---|---|---|---|---|
| Architecture and engineering | 2,247 | 56.7 | 8.1 | 55.3 | 8.4 | 50.0 | 9.0 | 47.0 | 9.1 | 49.5 | 9.2 | 51.6 | 8.6 |
| Arts, design, entertainment, sports, and media | 2,977 | 49.3 | 9.3 | 49.2 | 10.0 | 54.8 | 9.8 | 48.3 | 9.6 | 49.9 | 9.5 | 46.9 | 9.6 |
| Building and grounds cleaning and maintenance | 929 | 53.7 | 9.3 | 49.7 | 10.3 | 47.8 | 10.2 | 47.5 | 10.4 | 49.5 | 10.0 | 50.6 | 10.0 |
| Business and financial operations | 10,975 | 50.0 | 9.5 | 49.9 | 9.6 | 49.8 | 9.5 | 49.7 | 9.3 | 51.7 | 9.3 | 53.1 | 9.2 |
| Community and social services | 5,478 | 47.1 | 9.7 | 47.9 | 9.6 | 51.2 | 9.8 | 54.0 | 9.5 | 48.0 | 9.3 | 46.6 | 10.2 |
| Computer and mathematical occupations | 4,216 | 54.4 | 8.5 | 53.7 | 9.1 | 50.6 | 9.3 | 47.6 | 9.4 | 48.9 | 9.4 | 53.7 | 8.4 |
| Construction and extraction occupations | 1,605 | 57.2 | 7.9 | 51.5 | 10.0 | 47.4 | 10.1 | 46.2 | 10.2 | 49.9 | 10.0 | 50.1 | 9.9 |
| Education, training, and library occupations | 11,888 | 46.9 | 9.7 | 48.4 | 10.0 | 51.9 | 9.8 | 53.4 | 9.5 | 48.1 | 9.7 | 47.0 | 10.2 |
| Farming, fishing, and forestry | 420 | 54.4 | 9.0 | 49.6 | 10.5 | 44.8 | 11.2 | 44.3 | 11.0 | 47.4 | 11.1 | 47.1 | 10.7 |
| Food preparation and food service | 6,049 | 48.5 | 10.3 | 48.6 | 10.5 | 48.6 | 10.3 | 48.5 | 10.3 | 49.9 | 10.5 | 49.1 | 10.3 |
| Healthcare practitioner and technical occupations | 3,790 | 49.1 | 9.8 | 53.3 | 9.6 | 50.1 | 10.3 | 49.9 | 10.1 | 47.4 | 9.9 | 48.2 | 10.1 |
| Healthcare support occupations | 3,802 | 47.3 | 10.4 | 50.3 | 10.3 | 48.2 | 10.6 | 50.5 | 10.8 | 47.7 | 10.7 | 49.5 | 10.8 |
| Installation, maintenance, and repair occupations | 2,225 | 57.8 | 8.2 | 52.1 | 9.9 | 46.9 | 9.9 | 46.1 | 10.4 | 49.1 | 10.3 | 51.1 | 9.7 |
| Legal | 1,659 | 49.9 | 9.1 | 50.3 | 9.2 | 52.6 | 9.4 | 50.5 | 9.5 | 50.0 | 9.1 | 49.5 | 9.4 |
| Life, physical, and social sciences | 2,365 | 49.3 | 9.2 | 55.2 | 10.0 | 52.4 | 9.5 | 50.0 | 9.3 | 46.7 | 9.4 | 47.4 | 9.6 |
| Management | 9,189 | 50.9 | 9.4 | 50.3 | 9.1 | 51.1 | 9.2 | 50.7 | 8.9 | 52.7 | 9.0 | 50.7 | 9.2 |
| Military specific occupations | 1,928 | 55.3 | 8.7 | 51.2 | 9.9 | 46.7 | 9.8 | 47.8 | 10.1 | 48.9 | 10.0 | 49.8 | 10.0 |
| Office and administrative support | 8,949 | 47.2 | 9.8 | 48.2 | 10.1 | 49.5 | 10.3 | 50.2 | 10.1 | 49.0 | 9.7 | 51.7 | 9.5 |
| Personal care and personal service | 2,511 | 46.8 | 10.2 | 47.9 | 10.4 | 48.8 | 10.6 | 50.8 | 10.6 | 48.8 | 10.6 | 47.7 | 10.6 |
| Production occupations | 2,494 | 55.1 | 9.2 | 52.2 | 9.8 | 47.7 | 9.9 | 47.6 | 10.4 | 49.8 | 10.0 | 52.6 | 9.6 |
| Protective services | 1,850 | 53.3 | 9.4 | 50.8 | 9.8 | 48.8 | 9.7 | 49.7 | 10.4 | 49.4 | 10.0 | 50.8 | 10.4 |
| Sales and related occupations | 9,910 | 50.0 | 10.0 | 49.1 | 10.0 | 49.2 | 10.0 | 49.4 | 10.0 | 54.3 | 10.5 | 50.5 | 9.8 |
| Transportation and materials moving | 1,867 | 54.7 | 9.0 | 51.0 | 9.7 | 48.5 | 9.9 | 48.3 | 10.1 | 50.5 | 9.8 | 52.0 | 9.6 |
3.4.7.4 Academic major
For differences by major category for the six GOTs, see Table 3.12.
| Major category | n | Realistic mean | Realistic SD | Investigative mean | Investigative SD | Artistic mean | Artistic SD | Social mean | Social SD | Enterprising mean | Enterprising SD | Conventional mean | Conventional SD |
|---|---|---|---|---|---|---|---|---|---|---|---|---|---|
| Agriculture, Agriculture Operations, and Related Sciences | 5,566 | 47.4 | 10.7 | 49.9 | 11.5 | 44.4 | 11.5 | 44.1 | 11.2 | 45.5 | 11.6 | 42.6 | 11.1 |
| Architecture and Related Services | 4,116 | 48.7 | 10.2 | 46.0 | 10.6 | 50.1 | 9.9 | 43.4 | 10.3 | 47.7 | 10.1 | 45.5 | 10.2 |
| Area, Ethnic, Cultural, Gender, and Group Studies | 1,595 | 42.3 | 11.0 | 44.7 | 11.1 | 50.8 | 10.7 | 50.1 | 10.7 | 45.7 | 10.6 | 42.0 | 10.8 |
| Biological and Biomedical Sciences | 33,108 | 43.5 | 10.5 | 58.1 | 10.1 | 45.6 | 11.1 | 45.9 | 10.4 | 43.2 | 11.0 | 43.2 | 10.8 |
| Business, Management, Marketing, and Related Support Services | 109,596 | 44.7 | 11.0 | 43.0 | 10.7 | 44.3 | 10.9 | 45.5 | 10.5 | 54.9 | 10.0 | 51.2 | 10.6 |
| Communication, Journalism, and Related Programs | 15,571 | 39.5 | 10.7 | 39.3 | 10.8 | 49.8 | 10.5 | 47.2 | 10.9 | 51.2 | 10.6 | 41.2 | 10.4 |
| Communications Technologies/Technicians and Support Services | 2,509 | 42.5 | 10.8 | 41.0 | 11.0 | 51.2 | 10.2 | 44.8 | 11.1 | 48.9 | 10.9 | 42.7 | 10.9 |
| Computer and Information Sciences and Support Services | 14,091 | 50.1 | 9.4 | 48.8 | 10.8 | 46.1 | 10.8 | 42.0 | 10.9 | 45.8 | 10.9 | 52.2 | 9.4 |
| Education | 32,583 | 40.9 | 10.9 | 42.0 | 11.0 | 47.7 | 11.1 | 55.3 | 9.8 | 44.6 | 11.1 | 41.6 | 10.9 |
| Engineering | 21,890 | 52.8 | 9.4 | 52.7 | 10.3 | 44.7 | 10.8 | 42.2 | 10.5 | 46.3 | 10.4 | 49.1 | 9.5 |
| Engineering Technologies and Engineering-Related Fields | 580 | 55.3 | 9.6 | 49.4 | 11.0 | 43.9 | 11.2 | 41.8 | 11.3 | 47.3 | 11.3 | 49.8 | 10.7 |
| English Language and Literature/Letters | 6,769 | 40.6 | 10.3 | 42.8 | 11.0 | 55.2 | 9.5 | 48.2 | 10.5 | 44.7 | 10.5 | 40.4 | 10.5 |
| Family and Consumer Sciences/Human Sciences | 4,225 | 39.6 | 10.5 | 41.9 | 11.2 | 45.6 | 10.9 | 53.8 | 10.2 | 44.9 | 11.2 | 41.5 | 11.0 |
| Foreign Languages, Literatures, and Linguistics | 3,364 | 41.8 | 10.4 | 45.0 | 11.2 | 51.2 | 10.4 | 48.8 | 10.4 | 45.0 | 10.7 | 42.4 | 10.6 |
| Health Professions and Related Programs | 52,354 | 41.7 | 11.0 | 50.2 | 11.1 | 44.3 | 11.4 | 48.9 | 10.8 | 43.5 | 11.3 | 42.5 | 11.2 |
| History | 8,272 | 44.4 | 10.6 | 44.2 | 10.5 | 49.7 | 9.9 | 47.8 | 10.0 | 46.0 | 10.5 | 42.6 | 10.3 |
| Homeland Security, Law Enforcement, Firefighting and Related Protective Services | 4,234 | 47.3 | 10.7 | 45.1 | 11.4 | 42.5 | 11.0 | 44.6 | 11.1 | 43.6 | 11.4 | 43.7 | 11.3 |
| Legal Professions and Studies | 7,778 | 43.0 | 11.3 | 43.9 | 11.4 | 46.3 | 11.0 | 46.6 | 11.1 | 48.4 | 10.9 | 45.8 | 10.9 |
| Library Science | 534 | 43.3 | 10.6 | 45.2 | 10.9 | 47.3 | 11.5 | 45.8 | 10.6 | 44.2 | 10.8 | 44.7 | 10.8 |
| Mathematics and Statistics | 9,576 | 44.9 | 10.4 | 48.7 | 11.1 | 45.6 | 11.0 | 47.7 | 10.9 | 46.0 | 10.4 | 50.1 | 10.5 |
| Military Science, Leadership and Operational Art | 371 | 53.5 | 9.7 | 46.6 | 11.9 | 42.9 | 10.6 | 41.5 | 11.7 | 43.6 | 12.0 | 43.8 | 11.8 |
| Multi/Interdisciplinary Studies | 1,495 | 43.4 | 10.7 | 46.6 | 11.0 | 50.6 | 10.2 | 48.8 | 10.2 | 47.9 | 10.3 | 43.8 | 10.2 |
| Natural Resources and Conservation | 2,918 | 48.0 | 9.8 | 54.0 | 10.0 | 47.6 | 11.4 | 44.2 | 10.8 | 43.0 | 10.7 | 41.6 | 10.5 |
| Parks, Recreation, Leisure, and Fitness Studies | 3,979 | 45.2 | 10.9 | 44.6 | 10.8 | 43.1 | 10.9 | 45.9 | 10.6 | 44.5 | 11.1 | 41.4 | 11.0 |
| Personal and Culinary Services | 1,246 | 45.1 | 11.5 | 43.2 | 11.7 | 49.0 | 11.1 | 44.3 | 11.9 | 46.7 | 11.6 | 43.3 | 11.7 |
| Philosophy and Religious Studies | 3,249 | 45.8 | 10.5 | 47.5 | 11.0 | 53.0 | 10.2 | 49.9 | 10.2 | 46.2 | 10.6 | 43.0 | 10.6 |
| Physical Sciences | 9,885 | 47.1 | 10.4 | 57.3 | 9.8 | 46.3 | 10.9 | 44.0 | 10.4 | 43.1 | 10.7 | 45.8 | 10.2 |
| Psychology | 71,076 | 41.3 | 10.5 | 46.6 | 11.3 | 50.4 | 11.0 | 54.1 | 9.7 | 45.4 | 10.5 | 41.2 | 10.4 |
| Public Administration and Social Service Professions | 5,947 | 41.0 | 11.1 | 42.4 | 11.1 | 46.8 | 11.2 | 54.0 | 10.5 | 45.9 | 11.1 | 42.8 | 11.1 |
| Social Sciences | 33,879 | 42.9 | 10.8 | 45.0 | 10.9 | 48.0 | 10.7 | 49.2 | 10.6 | 48.3 | 10.9 | 44.9 | 10.9 |
| Theology and Religious Vocations | 3,290 | 45.9 | 10.7 | 45.5 | 11.0 | 52.5 | 10.6 | 54.9 | 9.7 | 45.9 | 10.4 | 42.3 | 11.0 |
| Transportation and Materials Moving | 690 | 53.7 | 9.6 | 47.4 | 10.9 | 43.8 | 10.5 | 40.8 | 11.1 | 45.4 | 11.2 | 45.8 | 11.0 |
| Visual and Performing Arts | 11,787 | 42.2 | 10.7 | 42.1 | 11.6 | 55.1 | 9.4 | 43.2 | 11.3 | 44.3 | 11.0 | 40.2 | 11.0 |
3.5 GOT codes
3.5.1 How GOT codes are computed
The Strong 244 assessment assigns a GOT code to every respondent. This is a change from previous versions of the assessment where it was possible that low interest levels could result in a respondent not getting a GOT code. This pattern was known as a “flat” GOT code. While flat profiles (defined as all or mostly low scores on the GOTs and BISs, zero or one letter GOT code, few occupation similarity scores above 40) still require careful interpretation, respondents will now receive a code for inclusion in their interpretation.
Here, GOT codes are somewhere between one and three letters, representing the themes a respondent displays the most interest in. The first step of assigning GOT codes is to rank the six themes using the following rules:
- Descending standard scores
- If tied, break ties in descending order of the mean score of the Basic Interest Scales that are associated with each GOT theme
- If still tied, break ties in order of RIASEC
To get the code, the top-ranked theme is letter one, regardless of what the standard score for that theme is. If the theme for rank two has a standard score of 50 or above, then it is assigned as letter two. If the theme for rank three has a standard score of 50 or above, then it is assigned as letter three.
For example, if the standard scores are Realistic 44, Investigative 46, Artistic 49, Social 52, Enterprising 57, and Conventional 43, the order of the themes would be ESAIRC, and the GOT code would be ES.
3.5.2 Distribution of GOT code first letter in the GRS
For the frequencies of the GOT code first letter by gender in the GRS, see Table 3.13. The most frequent first letter for females is S, while the most frequent first letter for males is R, reflecting gender differences where females have higher scores than males in Social, and males have higher scores than females in Realistic.
| GOT | Female n | Male n | Total N |
|---|---|---|---|
| R | 2,946 | 14,416 | 17,362 |
| I | 7,715 | 8,151 | 15,866 |
| A | 9,764 | 5,780 | 15,544 |
| S | 12,423 | 4,836 | 17,259 |
| E | 5,831 | 7,606 | 13,437 |
| C | 11,321 | 9,211 | 20,532 |